One task. The right tool.
Scientific Figure Tools
Explore flow diagrams, data plots, text diagrams, AI illustrations, and figure utilities. Choose a tool by your task and see its supported output formats.
22 of 22 tools
Reviewed simulated examples. Native figures and separate AI raster images are labelled below.
Scientific illustrations11
Explore an illustrated explanation of your research. Review scientific details and distinguish raster from native objects.
Graphical Abstract Maker
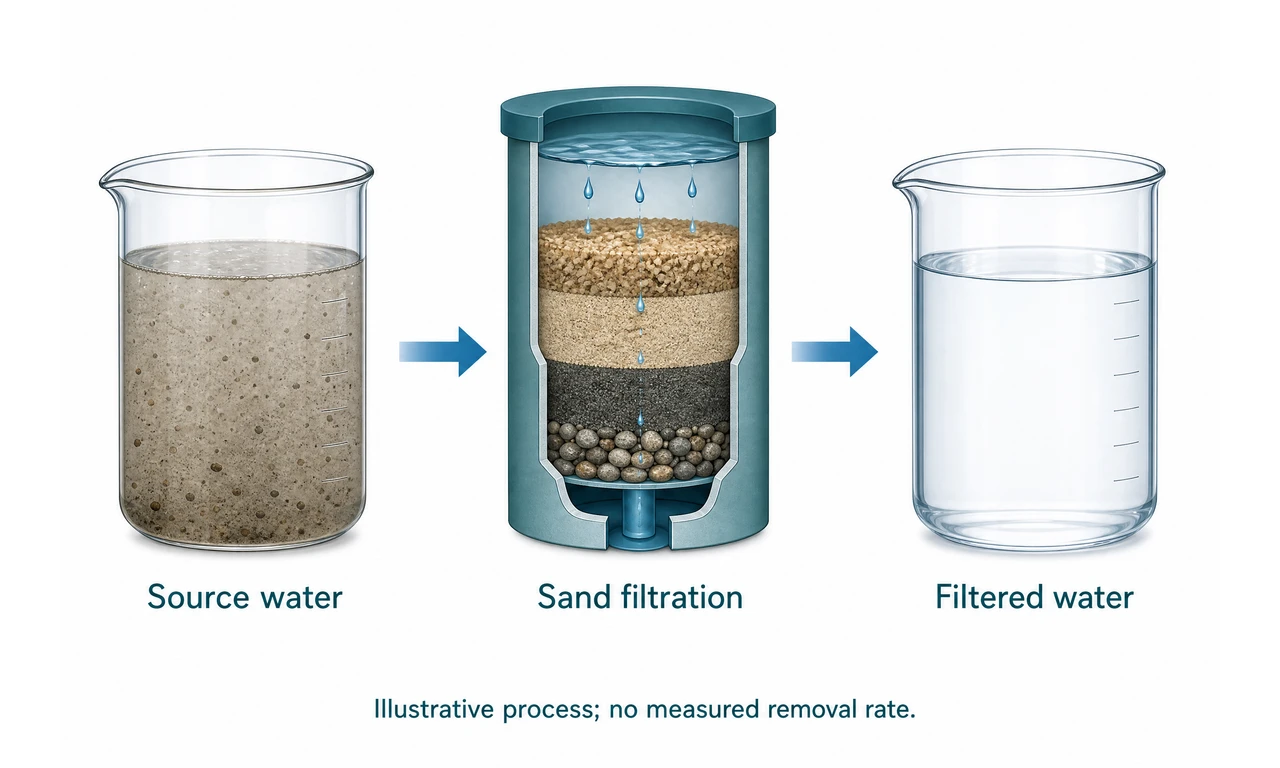
Turn your study summary into a graphical abstract draft. Choose a structured vector diagram or an AI illustration, with the editing range clearly explained.
Native diagram + separate AI illustration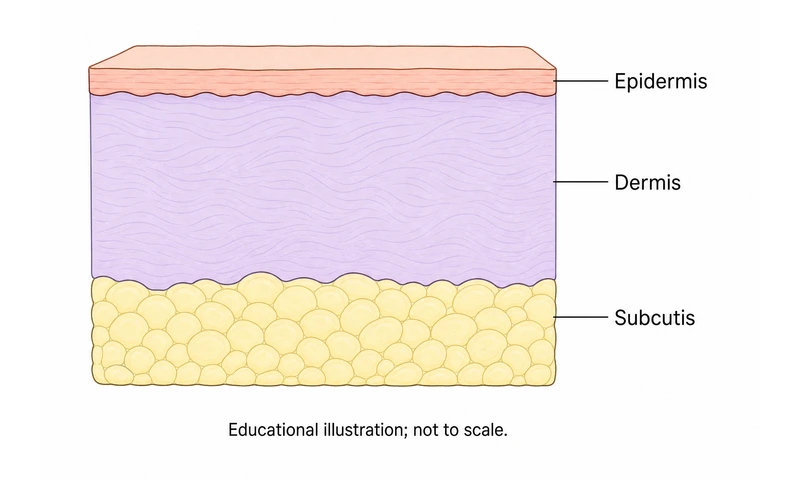
Medical Illustration Generator
Describe an anatomical scene or add a reference image to create an AI illustration draft. Review the anatomy and labels; AI output remains a bitmap.
AI illustration · PNG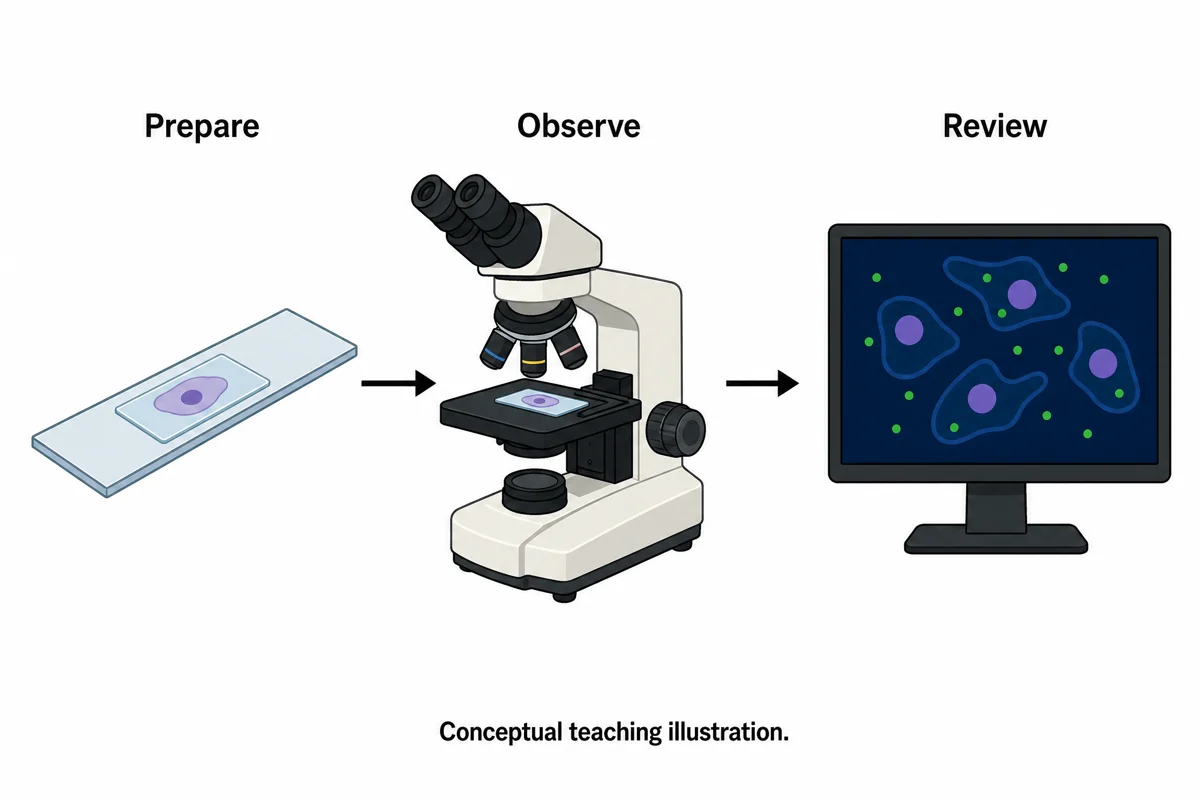
AI Scientific Image Generator
Turn a scientific brief into an AI illustration draft. Review visual relationships, requested labels and limitations, then download the original PNG.
AI illustration · PNG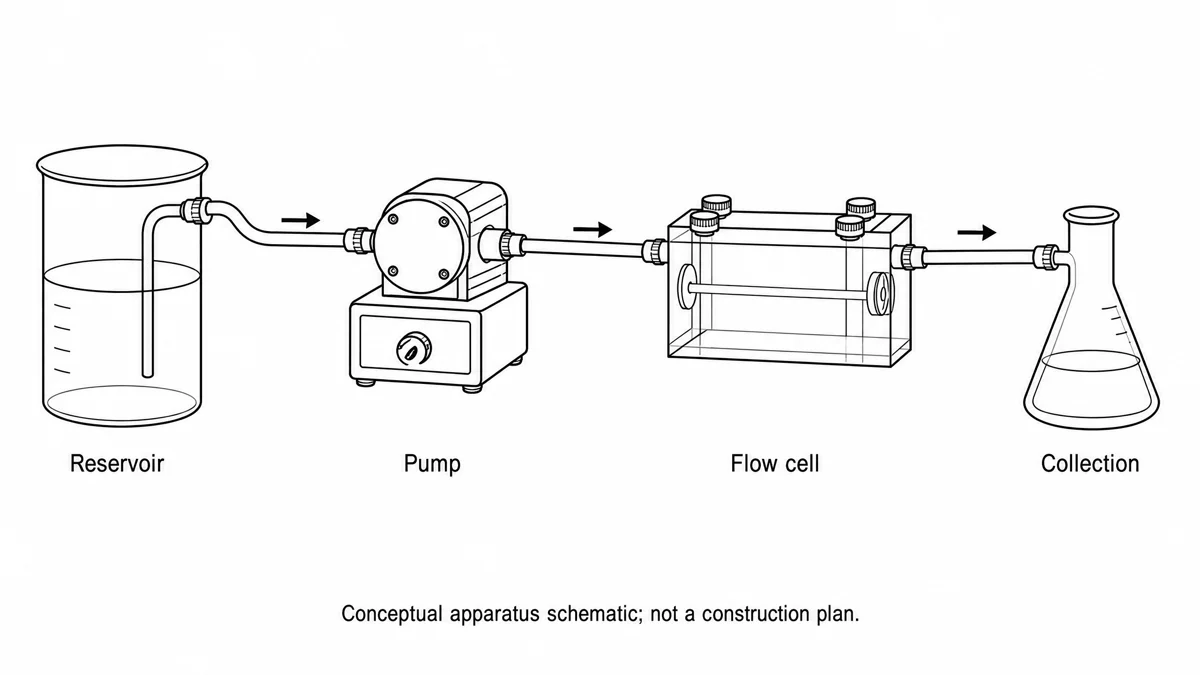
Schematic Diagram Maker
Describe an experimental apparatus and create an AI schematic draft. Review components, connections and flow direction, then download the original PNG.
AI illustration · PNG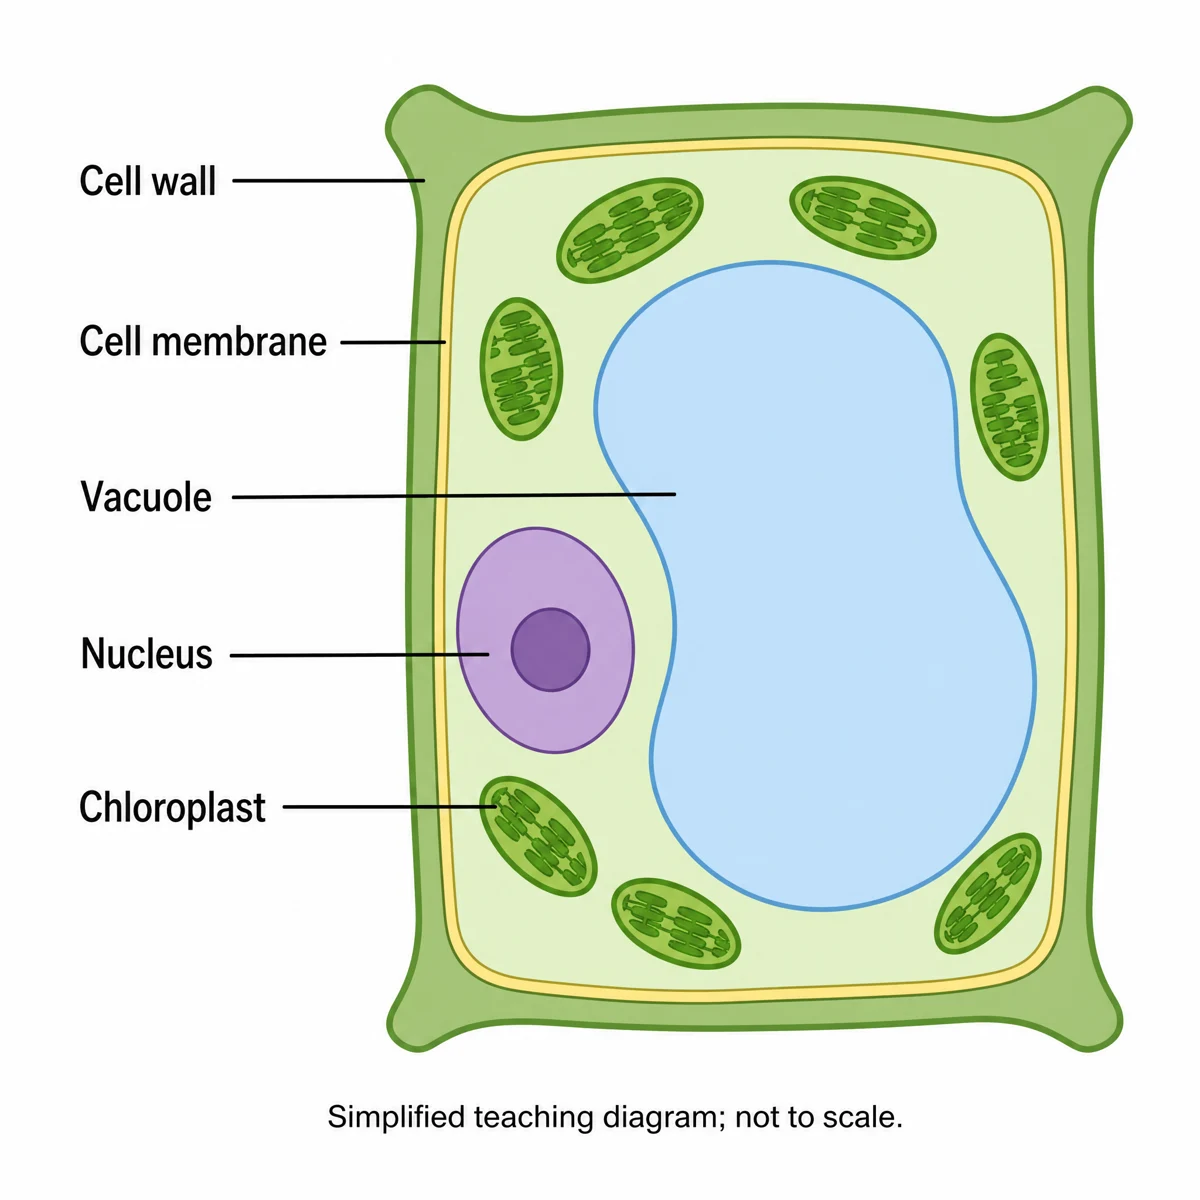
Biology Drawing Generator
Create a biology illustration draft from supplied structures and relationships. Review biological details and labels before downloading the original PNG.
AI illustration · PNG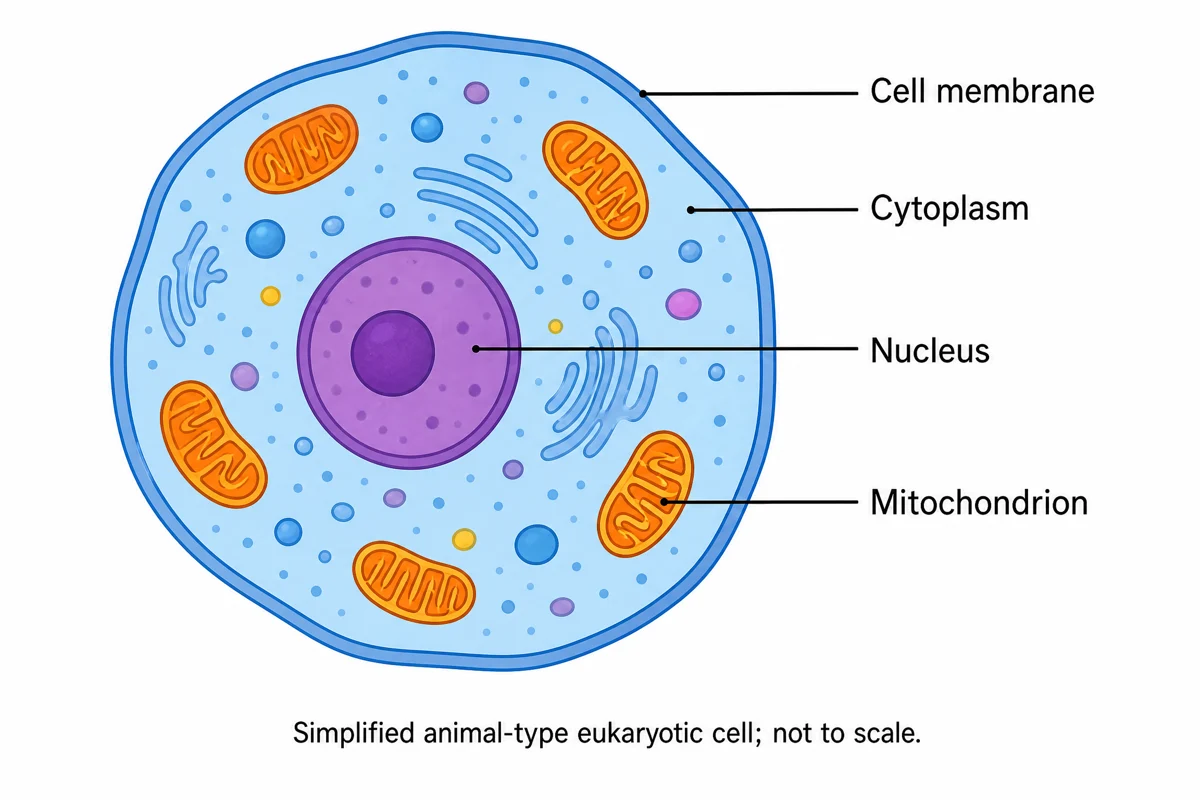
Eukaryotic Cell Diagram Generator
Create an AI eukaryotic cell diagram from your supplied cell type, organelles and exact labels. Review structure placement, then download the original PNG.
AI illustration · PNG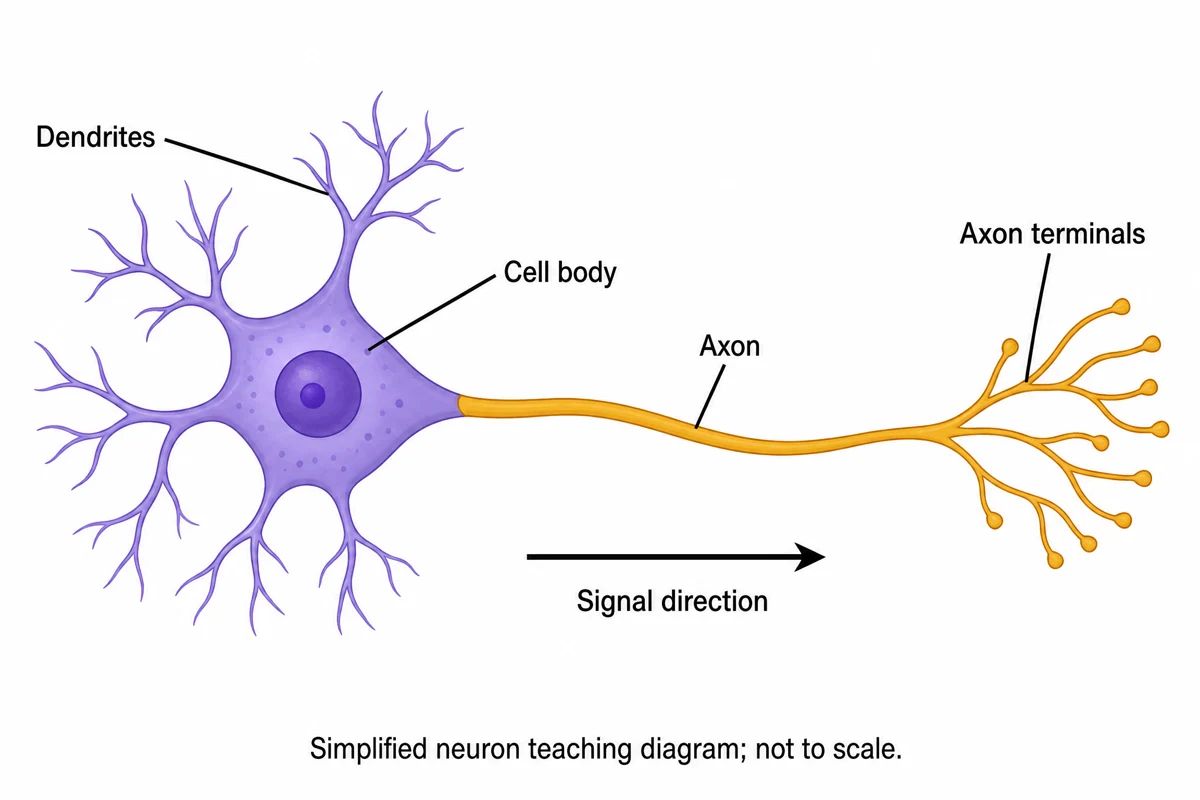
Neuron Diagram Generator
Describe a neuron and create an AI teaching diagram with supplied structures and labels. Review branches and signal direction before downloading the original PNG.
AI illustration · PNG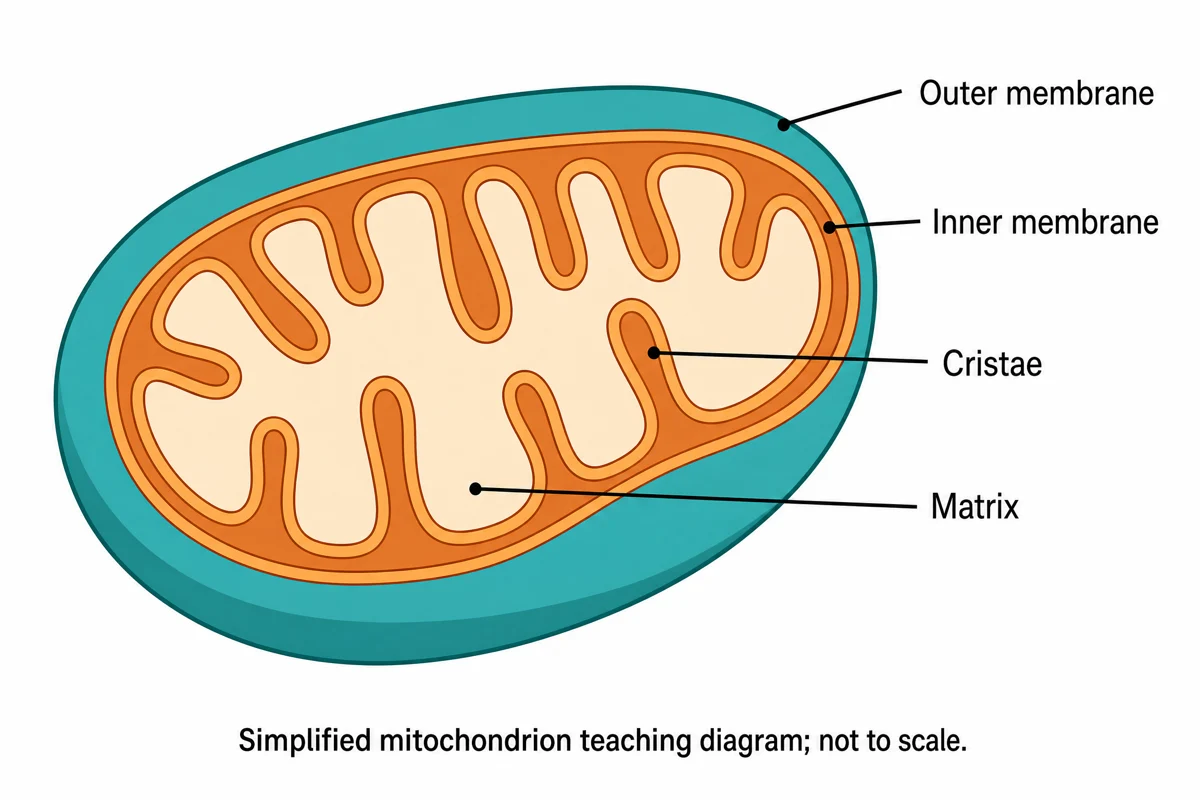
Mitochondria Diagram Generator
Create an AI mitochondrion cutaway from a supplied brief. Review the outer membrane, inner membrane, cristae and matrix labels, then download the original PNG.
AI illustration · PNG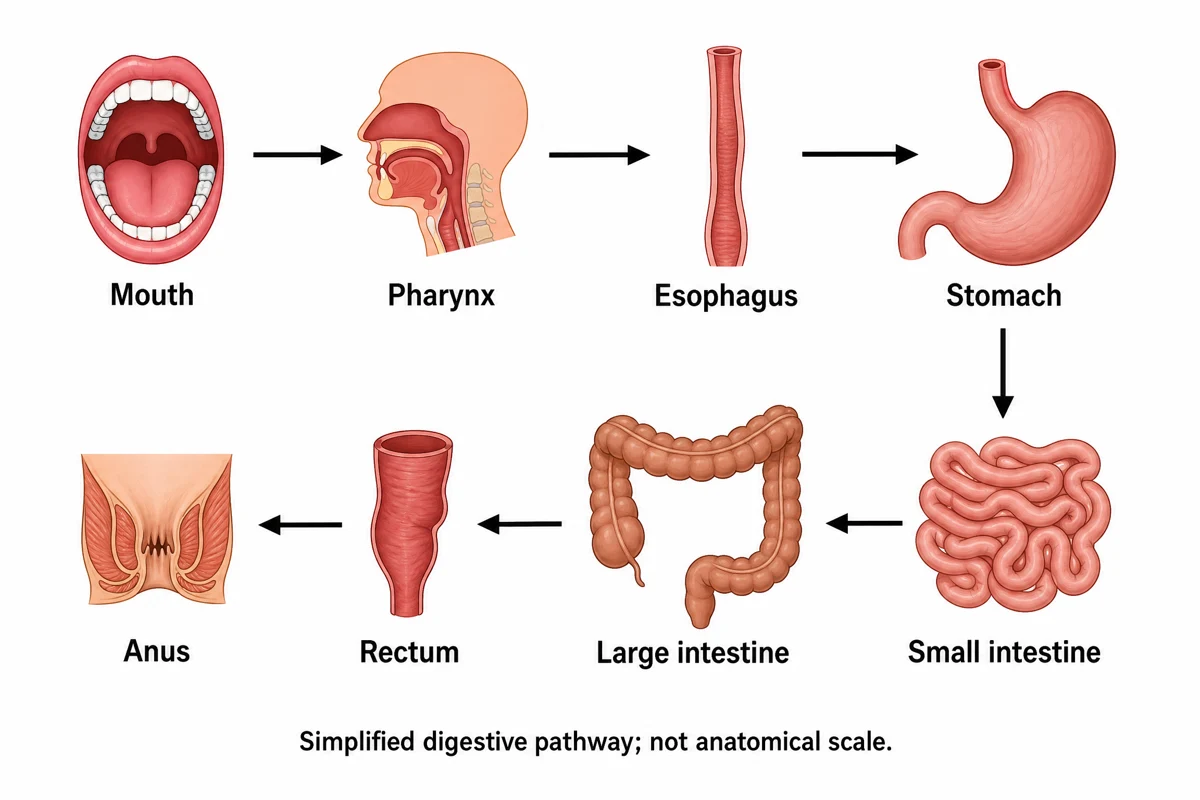
Food Digestion Diagram Generator
Create an AI food digestion pathway diagram from supplied organs and labels. Review the mouth-to-anus sequence and download the original PNG.
AI illustration · PNG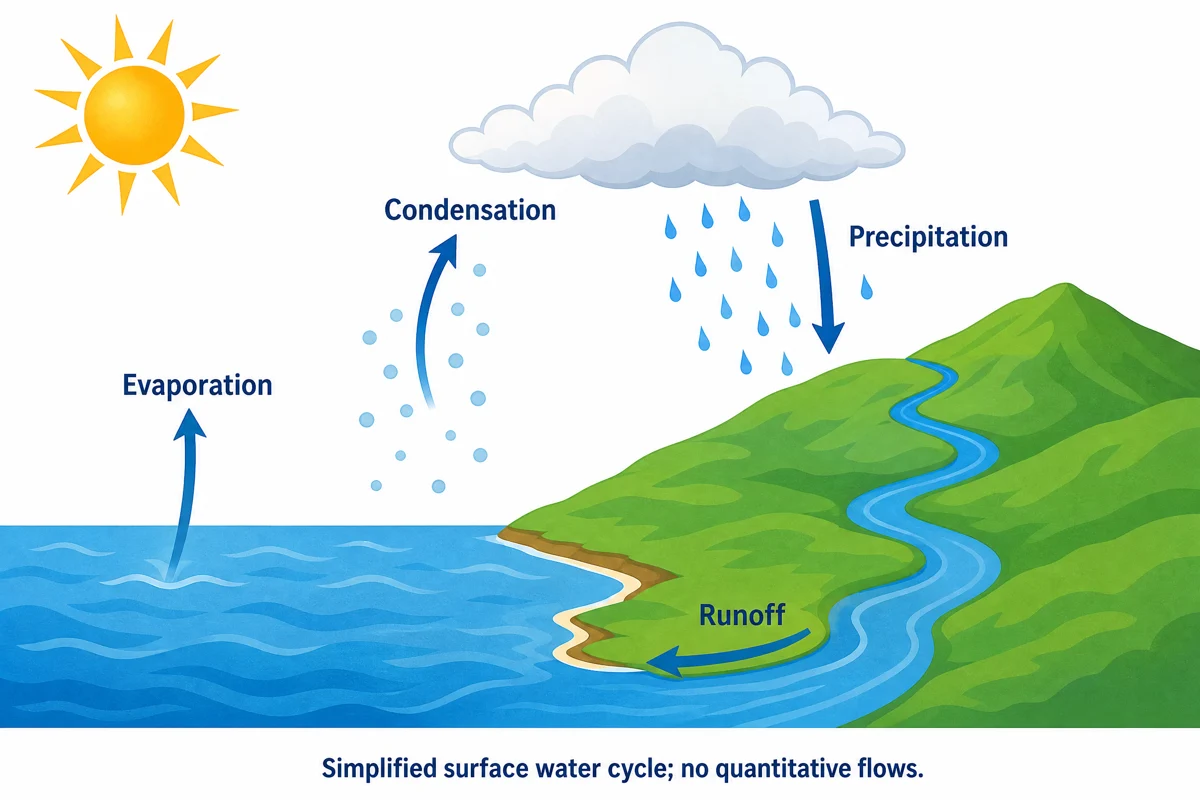
Water Cycle Diagram Generator
Create an AI surface water cycle diagram with supplied stores, process labels and arrows. Review evaporation, condensation, precipitation and runoff, then download PNG.
AI illustration · PNG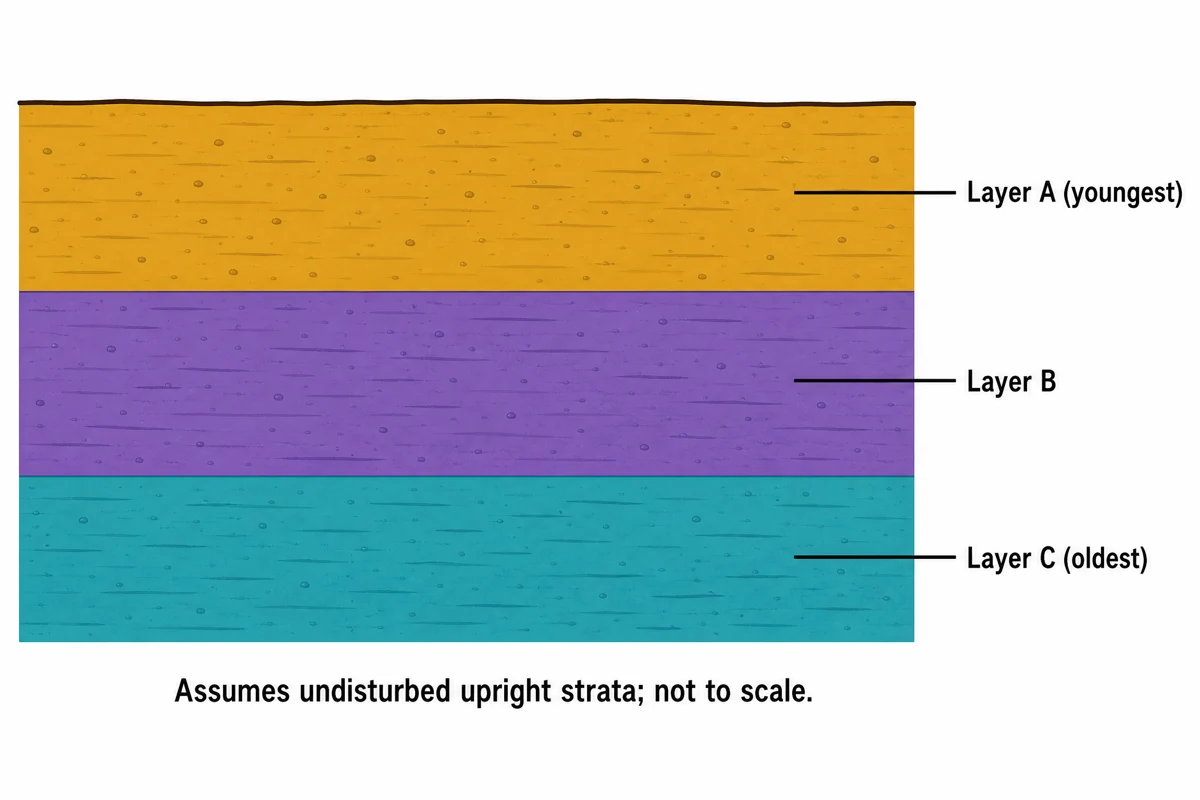
Rock Layers Diagram Generator
Create an AI rock layers cross-section from a supplied bed sequence. Review upright undisturbed strata and relative-age labels, then download the original PNG.
AI illustration · PNGFlow & reporting diagrams2
Map the stages of a review or trial. Keep the counts, exclusions, and reporting standard visible.
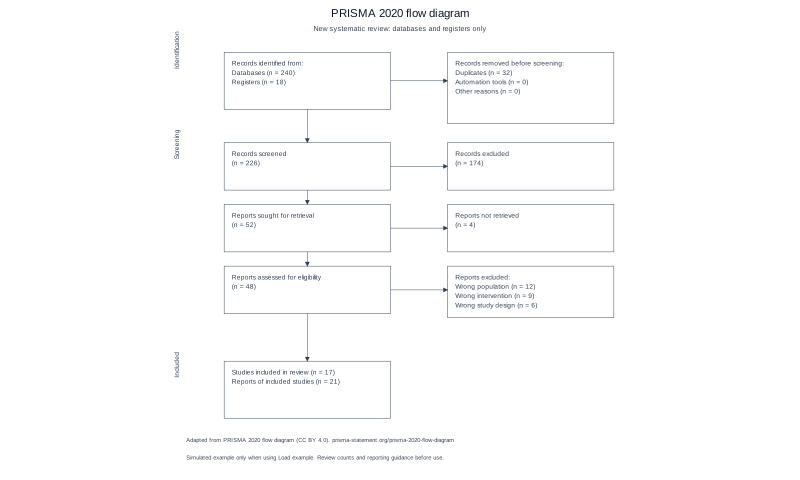
PRISMA Flow Diagram Generator
Enter your identification, screening, and included counts. Check the arithmetic and create a PRISMA 2020 flow diagram with supported manuscript exports.
Native figure · SVG / PPTX / PNG / PDF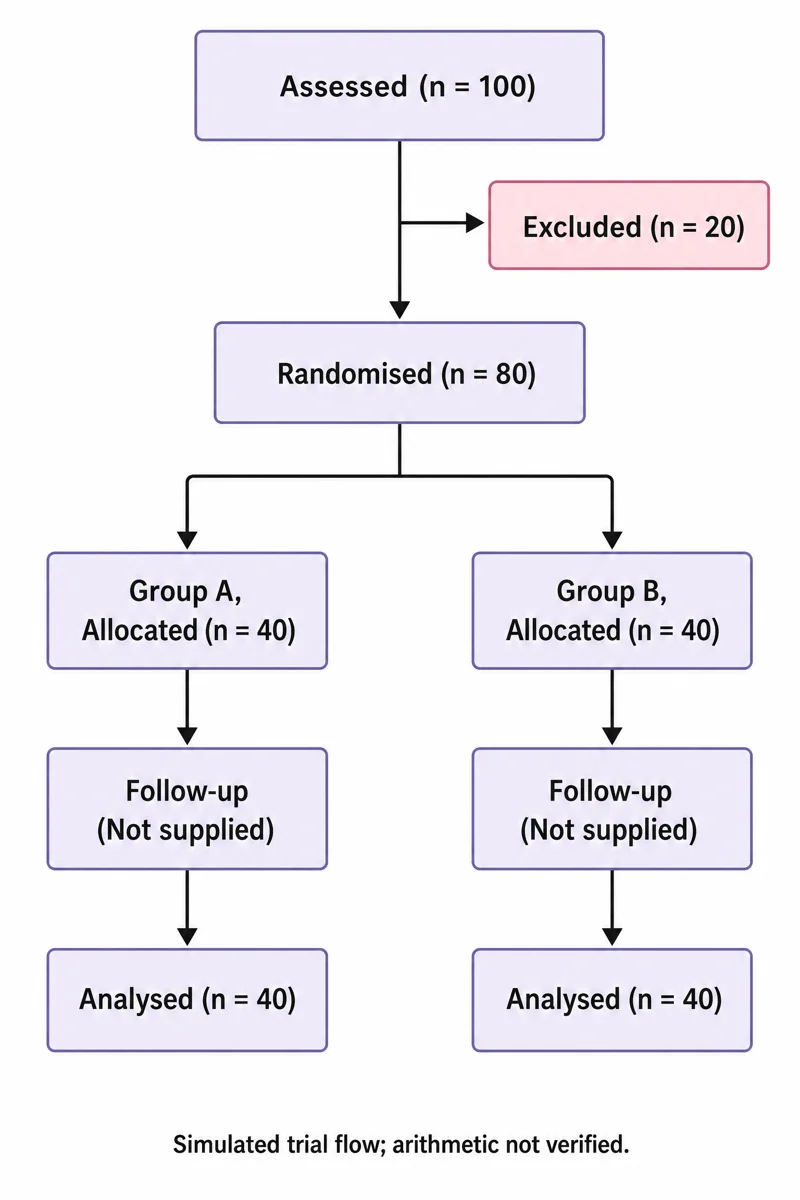
CONSORT Flow Diagram Generator
Build a CONSORT 2025 participant flow diagram for a supported parallel-group trial, with stage counts, arithmetic checks, and manuscript exports.
Native diagram + separate AI illustrationStatistics & data plots5
Start with your own numbers. Preserve the relationship between data, labels, and marks.
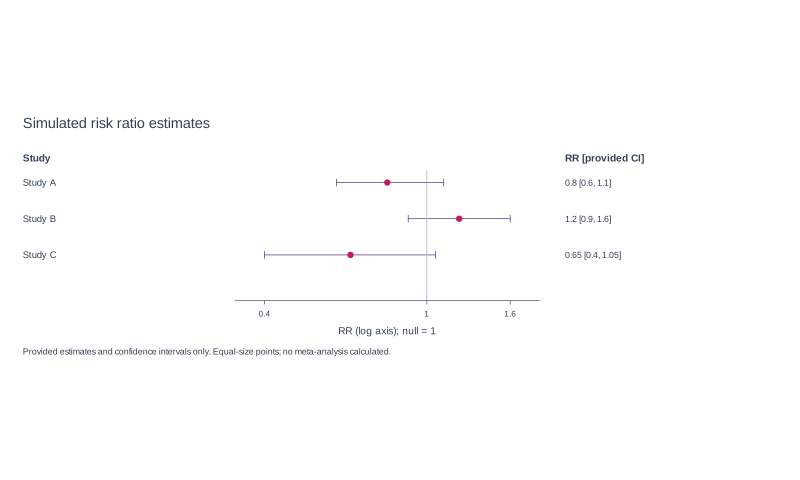
Forest Plot Generator
Enter study effect sizes and confidence intervals to create a forest plot. Set the effect measure, review the axis, and export the chart and source data.
Native figure · SVG / PPTX / PNG / PDF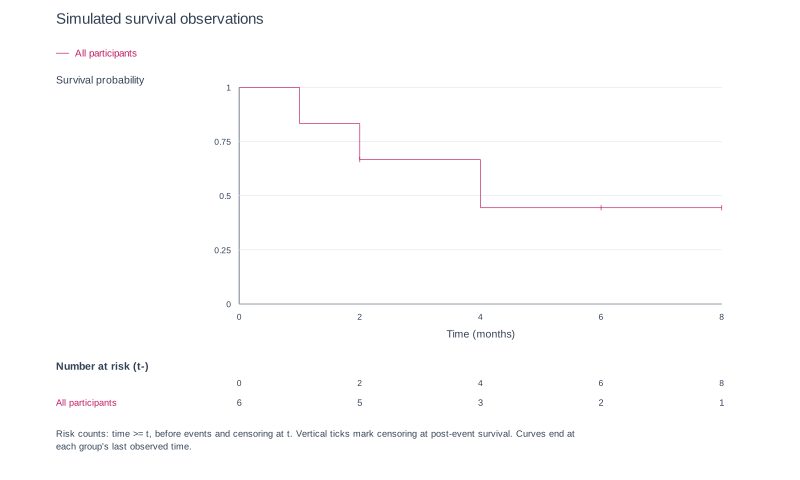
Kaplan–Meier Curve Generator
Create a Kaplan–Meier curve from event times and censoring indicators. Review the coding, groups, and risk counts before exporting the result.
Native figure · SVG / PPTX / PNG / PDF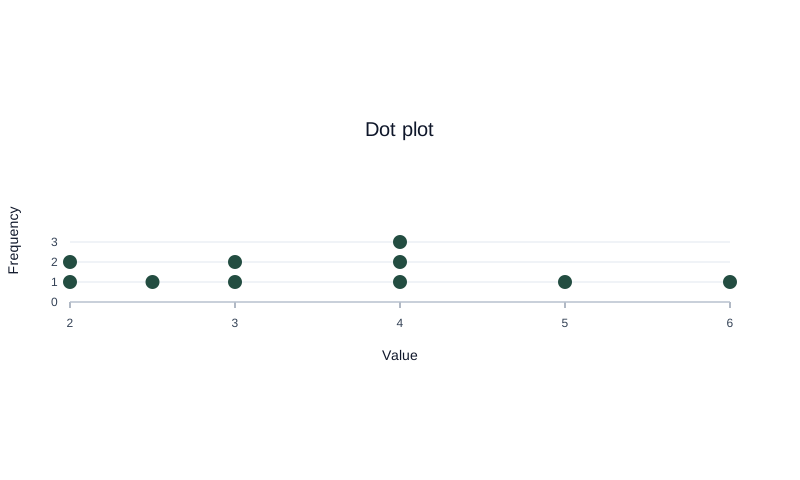
Dot Plot Generator
Paste numbers to create a dot plot. Values stack above their positions on the number line. Adjust labels, review the data, and export the chart.
Native figure · SVG / PPTX / PNG / PDF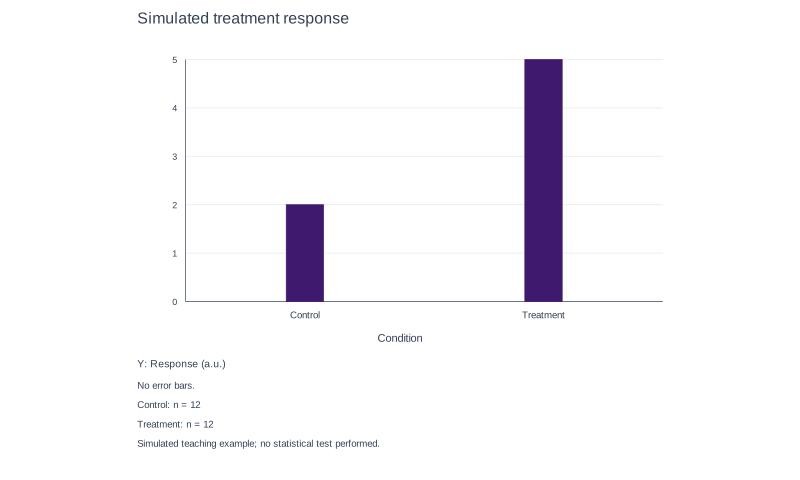
Bar Chart Maker
Paste a table to create a bar chart with labels and optional error values you provide. Choose the error type and export the supported chart formats.
Native figure · SVG / PPTX / PNG / PDF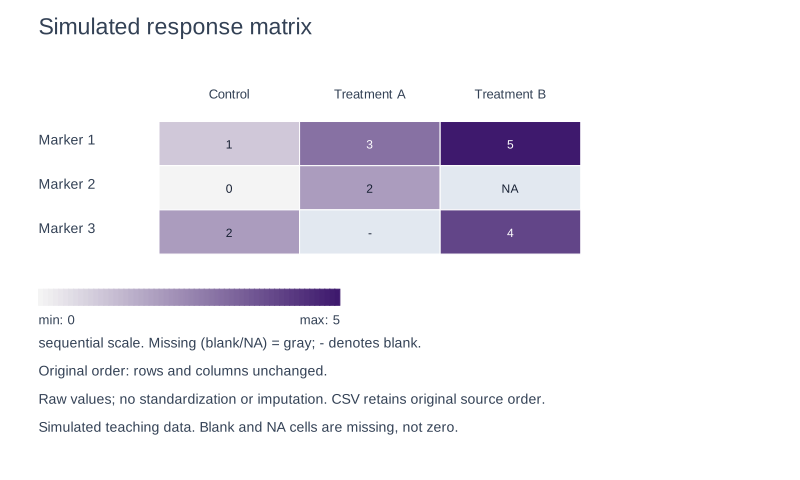
Heatmap Generator
Create a scientific heatmap from a numeric matrix. Choose a color scale, keep labels linked to data, and optionally cluster rows or columns.
Native figure · SVG / PPTX / PNG / PDFStructure & language3
Make relationships easier to follow. Review every connection and the meaning it carries.
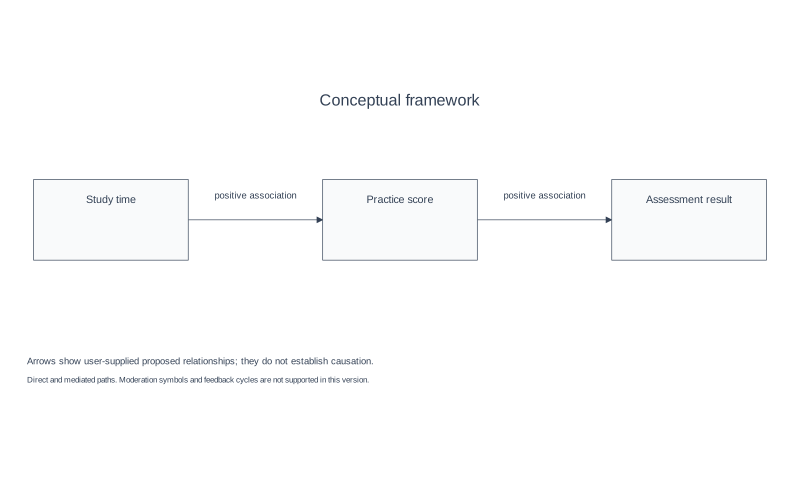
Conceptual Framework Generator
Define constructs, relationships, and direction to create a conceptual framework diagram for your thesis or paper. Review the meaning of each link.
Native figure · SVG / PPTX / PNG / PDF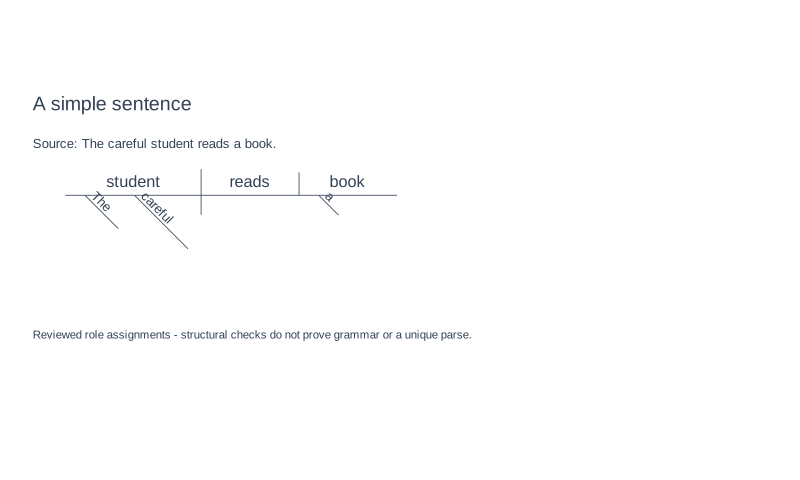
Sentence Diagram Generator
Type an English sentence to create a Reed-Kellogg diagram for supported structures. Review ambiguous parses and see when a sentence is outside the tool's scope.
Native figure · SVG / PPTX / PNG / PDF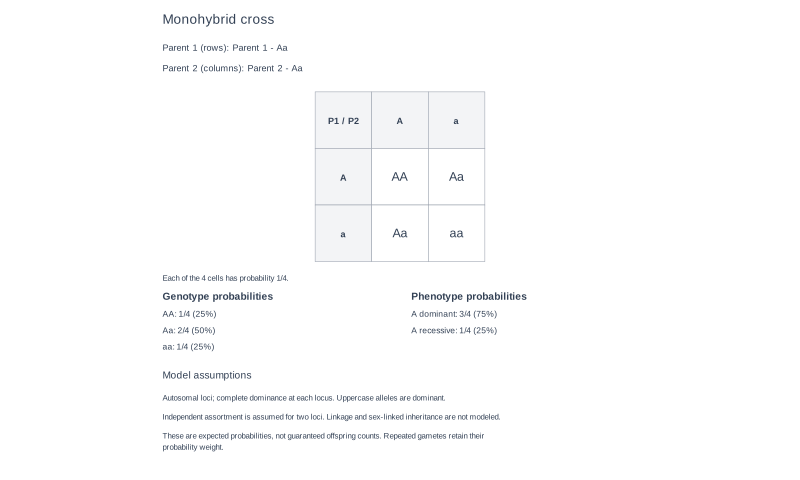
Punnett Square Generator
Choose parent genotypes to create a Punnett square and calculate genotype and phenotype proportions under the selected inheritance assumptions.
Native figure · SVG / PPTX / PNG / PDFFigure utilities1
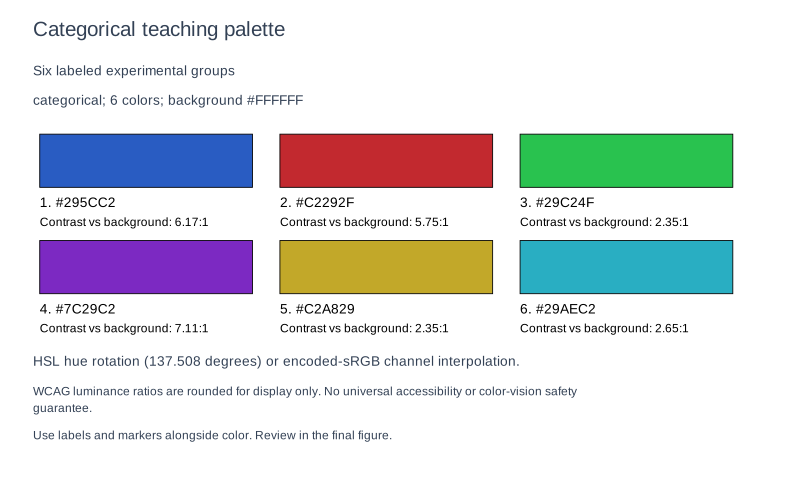
Choose colors that fit the data. Reuse palette values across your plotting workflow.