
Inputs → figure
Bar Chart Maker
Paste a table to create a bar chart with labels and optional error values you provide. Choose the error type and export the supported chart formats.
Native rendering runs in this tab · AI submissions are stored separately
SVG and PPTX retain native text and shapes. PDF currently supports basic Latin text. Check font substitution in your editor.
Example input
Start with a reproducible example
Self-authored, simulated data for exploring this workflow. It is not a user’s research or a public gallery submission.
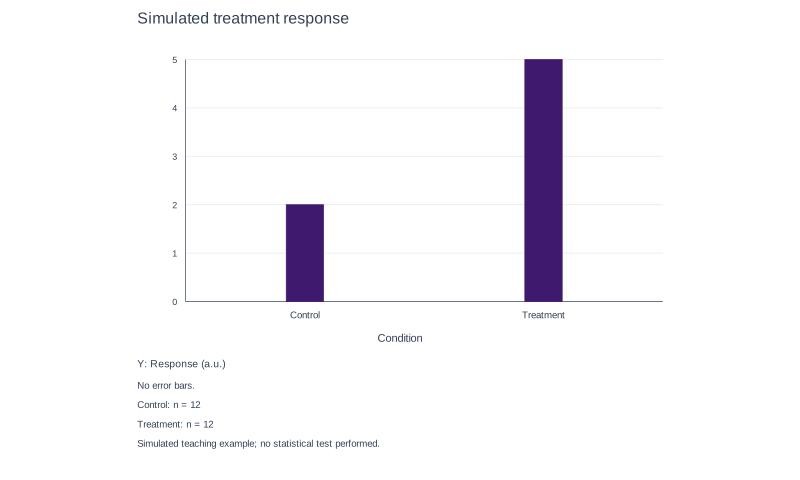
Use Control=2 and Treatment=5, n=12 for each, blank series, errorType=none, Condition and Response (a.u.) labels. No significance annotation or statistical test is supplied.
Reviewed output · self-authored simulated input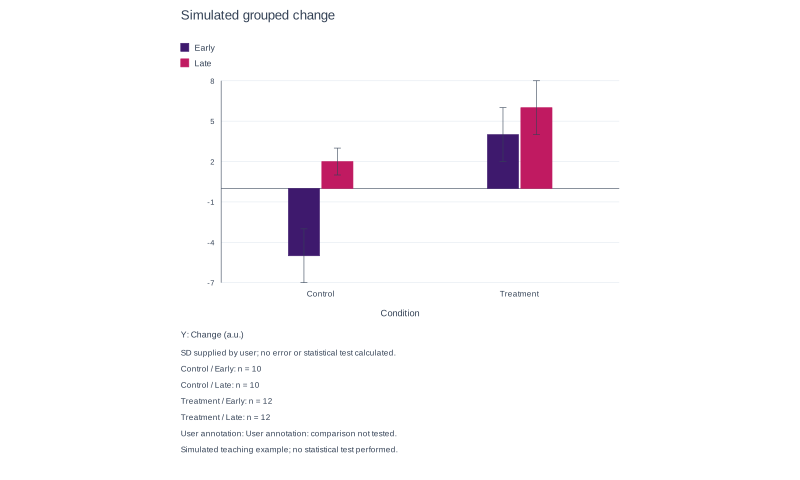
Use Control Early=-5 (SD 2), Control Late=2 (SD 1), Treatment Early=4 (SD 2), Treatment Late=6 (SD 2); n=10 for Control and n=12 for Treatment. Show the supplied annotation: comparison not tested.
Reviewed output · self-authored simulated inputRead the example input
{
  "title": "Simulated treatment response",
  "errorType": "none",
  "xLabel": "Condition",
  "yLabel": "Response (a.u.)",
  "csv": "category,series,value,error,lower,upper,n\nControl,,2,,,,12\nTreatment,,5,,,,12",
  "caption": "Simulated teaching example; no statistical test performed.",
  "annotation": ""
}
Use Load example to recreate the native figure and inspect its text, shapes and source values.
How values and error bars are displayed
The implementation draws basic or grouped bars from supplied CSV summaries, preserving category and series order. Select none, SD, SEM or CI explicitly. SD and SEM use supplied nonnegative symmetric errors; CI uses supplied lower and upper endpoints containing the bar value. The axis includes zero, negative values and the complete error range.
The chart does not calculate means, errors, p-values or hypothesis tests. Optional sample sizes, captions and annotations are copied from user input. An annotation does not certify a significance test. Stacked bars are not implemented. Editing or applying an AI draft requires confirmation before export.
Error bars and what they mean
Choose the supplied error type explicitly. SD and SEM are symmetric amounts in the error column; CI uses lower and upper endpoints containing the supplied value. Optional n remains blank if unknown. Errors, sample sizes and annotations are not inferred from the data.
Grouped and stacked bars
Basic bars use blank series labels; grouped bars use named series on every row and unique category/series pairs. Category and series order follows the source rows. Stacked bars are not implemented. Negative values and the complete error range remain within the axis.
Export
The current implementation connects native SVG, PNG, PPTX and basic-Latin vector PDF; source CSV is also included. Review the final file and font substitution in your editor.
How to use this tool
- Paste CSV with category,series,value,error,lower,upper,n columns.
- Choose none, SD, SEM or CI to match the supplied error information.
- Use blank series for basic bars or named series for every grouped row.
- Review labels, sample sizes, full error ranges and any supplied annotation.
- Confirm Create and inspect the chart and source-data exports.
Specifications and limits
- Input
- 1–60 summary rows; at most 20 categories and six series; unique category/series pairs
- Error types
- Explicit none, SD, SEM or CI; no errors or intervals calculated
- Statistics
- Sample sizes and annotations are supplied; no p-value or hypothesis test calculated
- Layouts
- Basic and grouped bars; stacked bars are not implemented
- Formats
- Native SVG/PNG/PPTX/basic-Latin vector PDF and source CSV connected
Guest native edits stay in this tab until you explicitly save a confirmed figure. Sign in to keep private works and revision history. Saved native works restore the figure and exports, not the original input form. AI tasks, images and references are private to their owner. Subscriptions and one-time packs are available for AI allowances. Native drawing and exports remain free. Understand export formats.
Frequently asked questions
Can I add error bars?
Yes. Choose SD, SEM or CI and enter the corresponding errors or interval endpoints. No error values are estimated.
Which error bar types are planned?
SD and SEM use supplied symmetric error amounts. CI uses supplied lower and upper bounds containing each bar value. These types are implemented.
Does the tool calculate significance?
No. It does not calculate p-values or run a statistical test from chart summaries.
Can I add a significance marker?
A supplied annotation can be displayed. Its wording remains your responsibility and does not represent a test performed by this tool.
Are grouped and stacked bars available?
Basic and grouped bars are implemented. Stacked bars are not implemented. Use named series consistently for grouped input.
Can I export a vector chart?
The current implementation connects native SVG, PNG, PPTX and basic-Latin vector PDF; source CSV is also included. Review the final file and font substitution in your editor.