
Inputs → figure
Heatmap Generator
Create a scientific heatmap from a numeric matrix. Choose a color scale, keep labels linked to data, and optionally cluster rows or columns.
Native rendering runs in this tab · AI submissions are stored separately
SVG and PPTX retain native text and shapes. PDF currently supports basic Latin text. Check font substitution in your editor.
Example input
Start with a reproducible example
Self-authored, simulated data for exploring this workflow. It is not a user’s research or a public gallery submission.
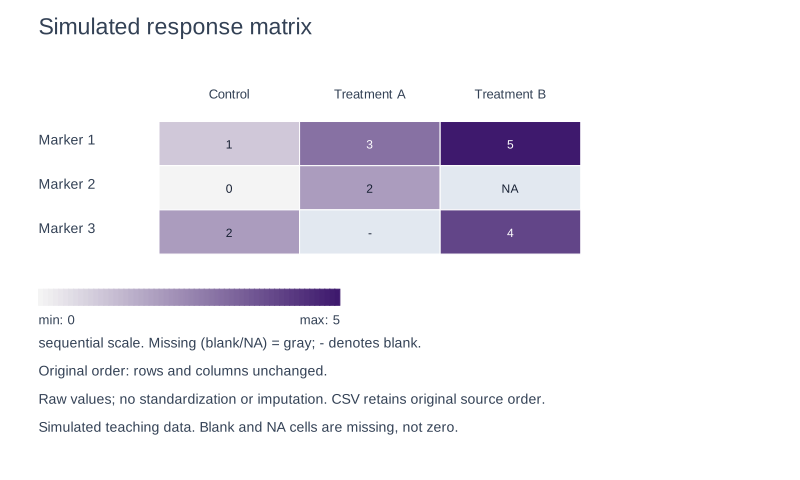
Use the 3-by-3 sequential matrix: Marker 1=(1,3,5), Marker 2=(0,2,NA), Marker 3=(2,blank,4), with Control, Treatment A and Treatment B columns. Keep original order and preserve blank/NA as missing, distinct from zero.
Reviewed output · self-authored simulated input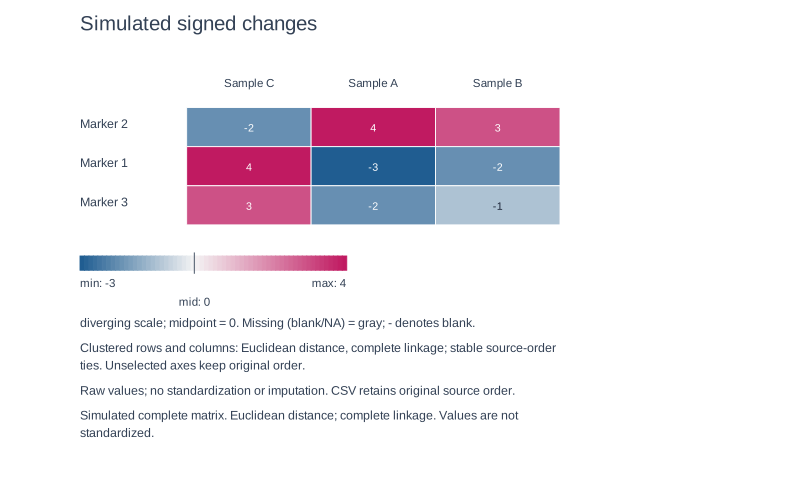
Use the complete signed 3-by-3 matrix: Marker 1=(-3,-2,4), Marker 2=(4,3,-2), Marker 3=(-2,-1,3). Choose diverging colour with midpoint 0 and both row/column clustering: Euclidean distance, complete linkage, stable source-order ties; no dendrogram or standardisation.
Reviewed output · self-authored simulated inputRead the example input
{
  "title": "Simulated response matrix",
  "csv": "row,Control,Treatment A,Treatment B\nMarker 1,1,3,5\nMarker 2,0,2,NA\nMarker 3,2,,4",
  "colorMode": "sequential",
  "midpoint": "",
  "clusterRows": false,
  "clusterColumns": false,
  "caption": "Simulated teaching data. Blank and NA cells are missing, not zero."
}
Use Load example to recreate the native figure and inspect its text, shapes and source values.
How matrix values map to heatmap colors
The implementation maps a labelled numeric matrix to a sequential or diverging colour scale with a numeric legend. A diverging scale requires an explicitly supplied midpoint within the observed range. Blank and NA cells remain missing and display separately from observed zero. Values are not normalised, standardised, imputed or discarded.
Optional row or column ordering uses Euclidean distance and complete-linkage hierarchical clustering, with stable source-order tie handling. Clustering requires a complete numeric matrix; missing cells block clustering rather than being filled or dropped. Only the resulting order is drawn, without a dendrogram. Labels and values are permuted together.
Colour scales that stay readable
Use sequential colour for ordered magnitude or diverging colour around an explicitly supplied midpoint within the observed range. The numeric legend follows the data range; missing cells have a separate display. Review the figure in its intended viewing conditions rather than assuming any palette guarantees accessibility.
Clustering rows and columns
Row and column clustering use Euclidean distance and complete linkage with stable source-order ties. Complete data are required; no missing row is removed or filled. The view shows the resulting order without a dendrogram, and unselected axes keep their original order.
Labels and export
The current implementation connects native SVG, PNG, PPTX and basic-Latin vector PDF; source CSV is also included. Review the final file and font substitution in your editor.
How to use this tool
- Paste CSV beginning with row and unique column labels.
- Select sequential colour or diverging colour with an explicit midpoint.
- Keep blank and NA cells as missing; use a complete matrix if clustering is requested.
- Review original or Euclidean/complete-linkage ordering and its labels.
- Confirm Create and inspect the figure and source CSV.
Specifications and limits
- Input
- 1–20 rows by 1–20 columns; unique labels; numeric, blank or NA cells
- Color
- Sequential or diverging; explicit in-range midpoint for diverging colour
- Clustering
- Optional Euclidean distance/complete linkage; stable source-order ties; order only, no dendrogram
- Data handling
- Missing cells stay missing; clustering requires complete data; no normalisation or imputation
- Formats
- Native SVG/PNG/PPTX/basic-Latin vector PDF and source CSV connected
Guest native edits stay in this tab until you explicitly save a confirmed figure. Sign in to keep private works and revision history. Saved native works restore the figure and exports, not the original input form. AI tasks, images and references are private to their owner. Subscriptions and one-time packs are available for AI allowances. Native drawing and exports remain free. Understand export formats.
Frequently asked questions
What data can I use?
Use a labelled numeric matrix of up to 20 rows by 20 columns, with unique row and column labels. Blank and NA cells represent missing values.
Does the tool cluster rows or columns?
Optional row and column ordering is implemented using Euclidean distance and complete linkage with stable source-order ties. It requires complete data and does not draw a dendrogram.
Will my data be normalized automatically?
No. Values are not normalised or standardised. Prepare any scientifically justified transformation outside the tool and describe it in your caption.
How are missing cells handled?
Blank and NA cells stay missing and are displayed separately from zero. Requested clustering is blocked until a complete matrix is supplied; the tool does not fill or delete observations.
Can I use the heatmap for geographic data?
This implementation displays scientific numeric matrices, not geographic or eye-tracking heatmaps.
Can I export a vector heatmap?
The current implementation connects native SVG, PNG, PPTX and basic-Latin vector PDF; source CSV is also included. Review the final file and font substitution in your editor.