
Inputs → figure
Dot Plot Generator
Paste numbers to create a dot plot. Values stack above their positions on the number line. Adjust labels, review the data, and export the chart.
10 observations · 6 distinct values
SVG and PPTX retain native text and shapes. PDF currently supports basic Latin text. Check font substitution in your editor.
Example input
Start with a reproducible example
Self-authored, simulated data for exploring this workflow. It is not a user’s research or a public gallery submission.
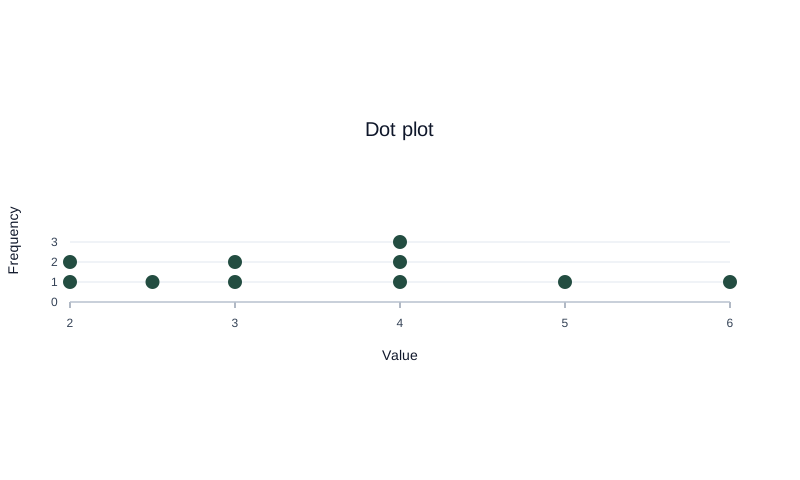
Use 2, 2, 2.5, 3, 3, 4, 4, 4, 5, 6.
Reviewed output · self-authored simulated input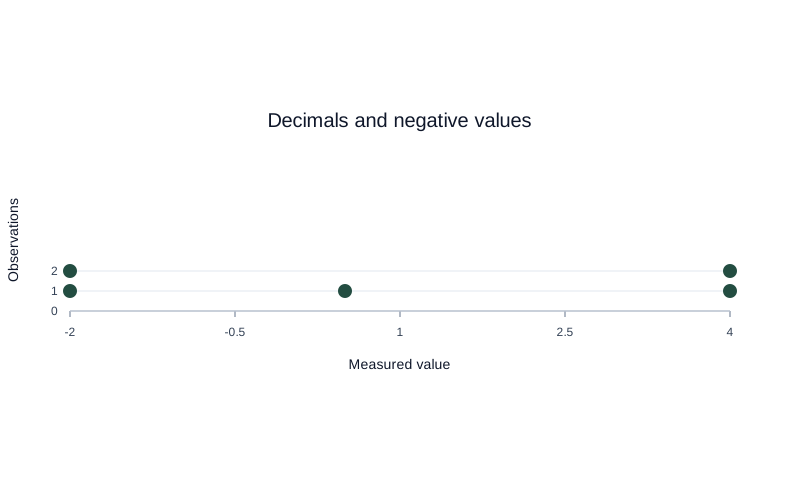
Use -2, -2, 0.5, 4, 4 with custom title and axis labels.
Reviewed output · self-authored simulated inputRead the example input
2, 2, 2.5, 3, 3, 4, 4, 4, 5, 6
Use Load example to recreate the native figure and inspect its text, shapes and source values.
How values stack on the number line
Each number is one observation. Repeated values stack above the same position on the number line. In the filled example, the three 4s produce a stack of three dots; 2.5 sits halfway between 2 and 3. Unequal numeric gaps stay unequal on the axis.
Paste the numbers, check the labels, and select Create dot plot. If you edit the input afterwards, the previous valid plot stays visible but export is disabled until you create the updated result. This helps keep the downloaded chart tied to the values you intended to use.
Dot plot vs histogram
This tool makes a frequency dot plot: each observation appears as a dot at its numeric position, and repeated values stack. A histogram groups observations into intervals or bins; the current dot plot does not automatically bin values, and it is not a Cleveland dot plot.
Reading clusters and gaps
Tall stacks show values that occur repeatedly, while separated stacks can reveal gaps in the observed data. The display preserves the entered numeric values within supported number precision, subject to IEEE 754 floating-point behavior; it does not smooth or group nearby values into a distribution.
Export and print
The current implementation supports SVG, PNG, and CSV downloads. SVG is a vector drawing, PNG is a raster image, and CSV preserves the plotted data; inspect labels and numeric values in the downloaded file before sharing or printing.
How to use this tool
- Paste up to 1,000 numeric observations.
- Add a title and number-line label if useful.
- Create the plot and inspect repeated-value stacks.
- Compare the displayed points with the input values.
- Download SVG, PNG, or CSV.
Specifications and limits
- Input
- Numbers separated by commas or line breaks; integers and decimals
- Capacity
- Up to 1,000 values and 100 unique values
- Plot
- Frequency dot plot on a number line; repeated values stack
- Exports
- SVG, PNG, and CSV are currently supported
- Numeric range
- Zero or nonzero absolute values from 1e-300 to 1e300; IEEE 754 precision applies
Guest native edits stay in this tab until you explicitly save a confirmed figure. Sign in to keep private works and revision history. Saved native works restore the figure and exports, not the original input form. AI tasks, images and references are private to their owner. Subscriptions and one-time packs are available for AI allowances. Native drawing and exports remain free. Understand export formats.
Frequently asked questions
Can I enter decimal values?
Yes. The current tool accepts decimal numbers.
How many values can I plot?
The current limit is 1,000 input values and 100 unique values.
How are repeated numbers shown?
Each observation is represented by a dot, with repeated values stacked above the same number-line position.
Is this a Cleveland dot plot?
No. This tool makes a frequency dot plot with values stacked on a number line.
Can I group values into intervals?
The current implementation plots entered values directly; it does not automatically bin or group them.
Which formats can I download?
The current tool supports SVG, PNG, and CSV downloads.