Inputs → figure
Graphical Abstract Maker
Turn your study summary into a graphical abstract draft. Choose a structured vector diagram or an AI illustration, with the editing range clearly explained.
Native rendering runs in this tab · AI submissions are stored separately
SVG and PPTX retain native text and shapes. PDF currently supports basic Latin text. Check font substitution in your editor.
Example input
Start with a reproducible example
Self-authored, simulated teaching input for exploring this workflow. It is not a user’s research or a public gallery submission.
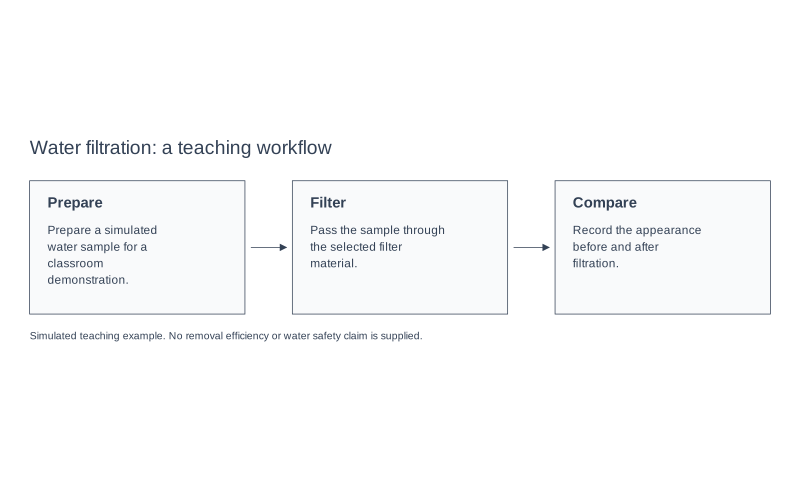
Use a three-stage water-filter study outline confirmed by the user.
Reviewed output · self-authored simulated input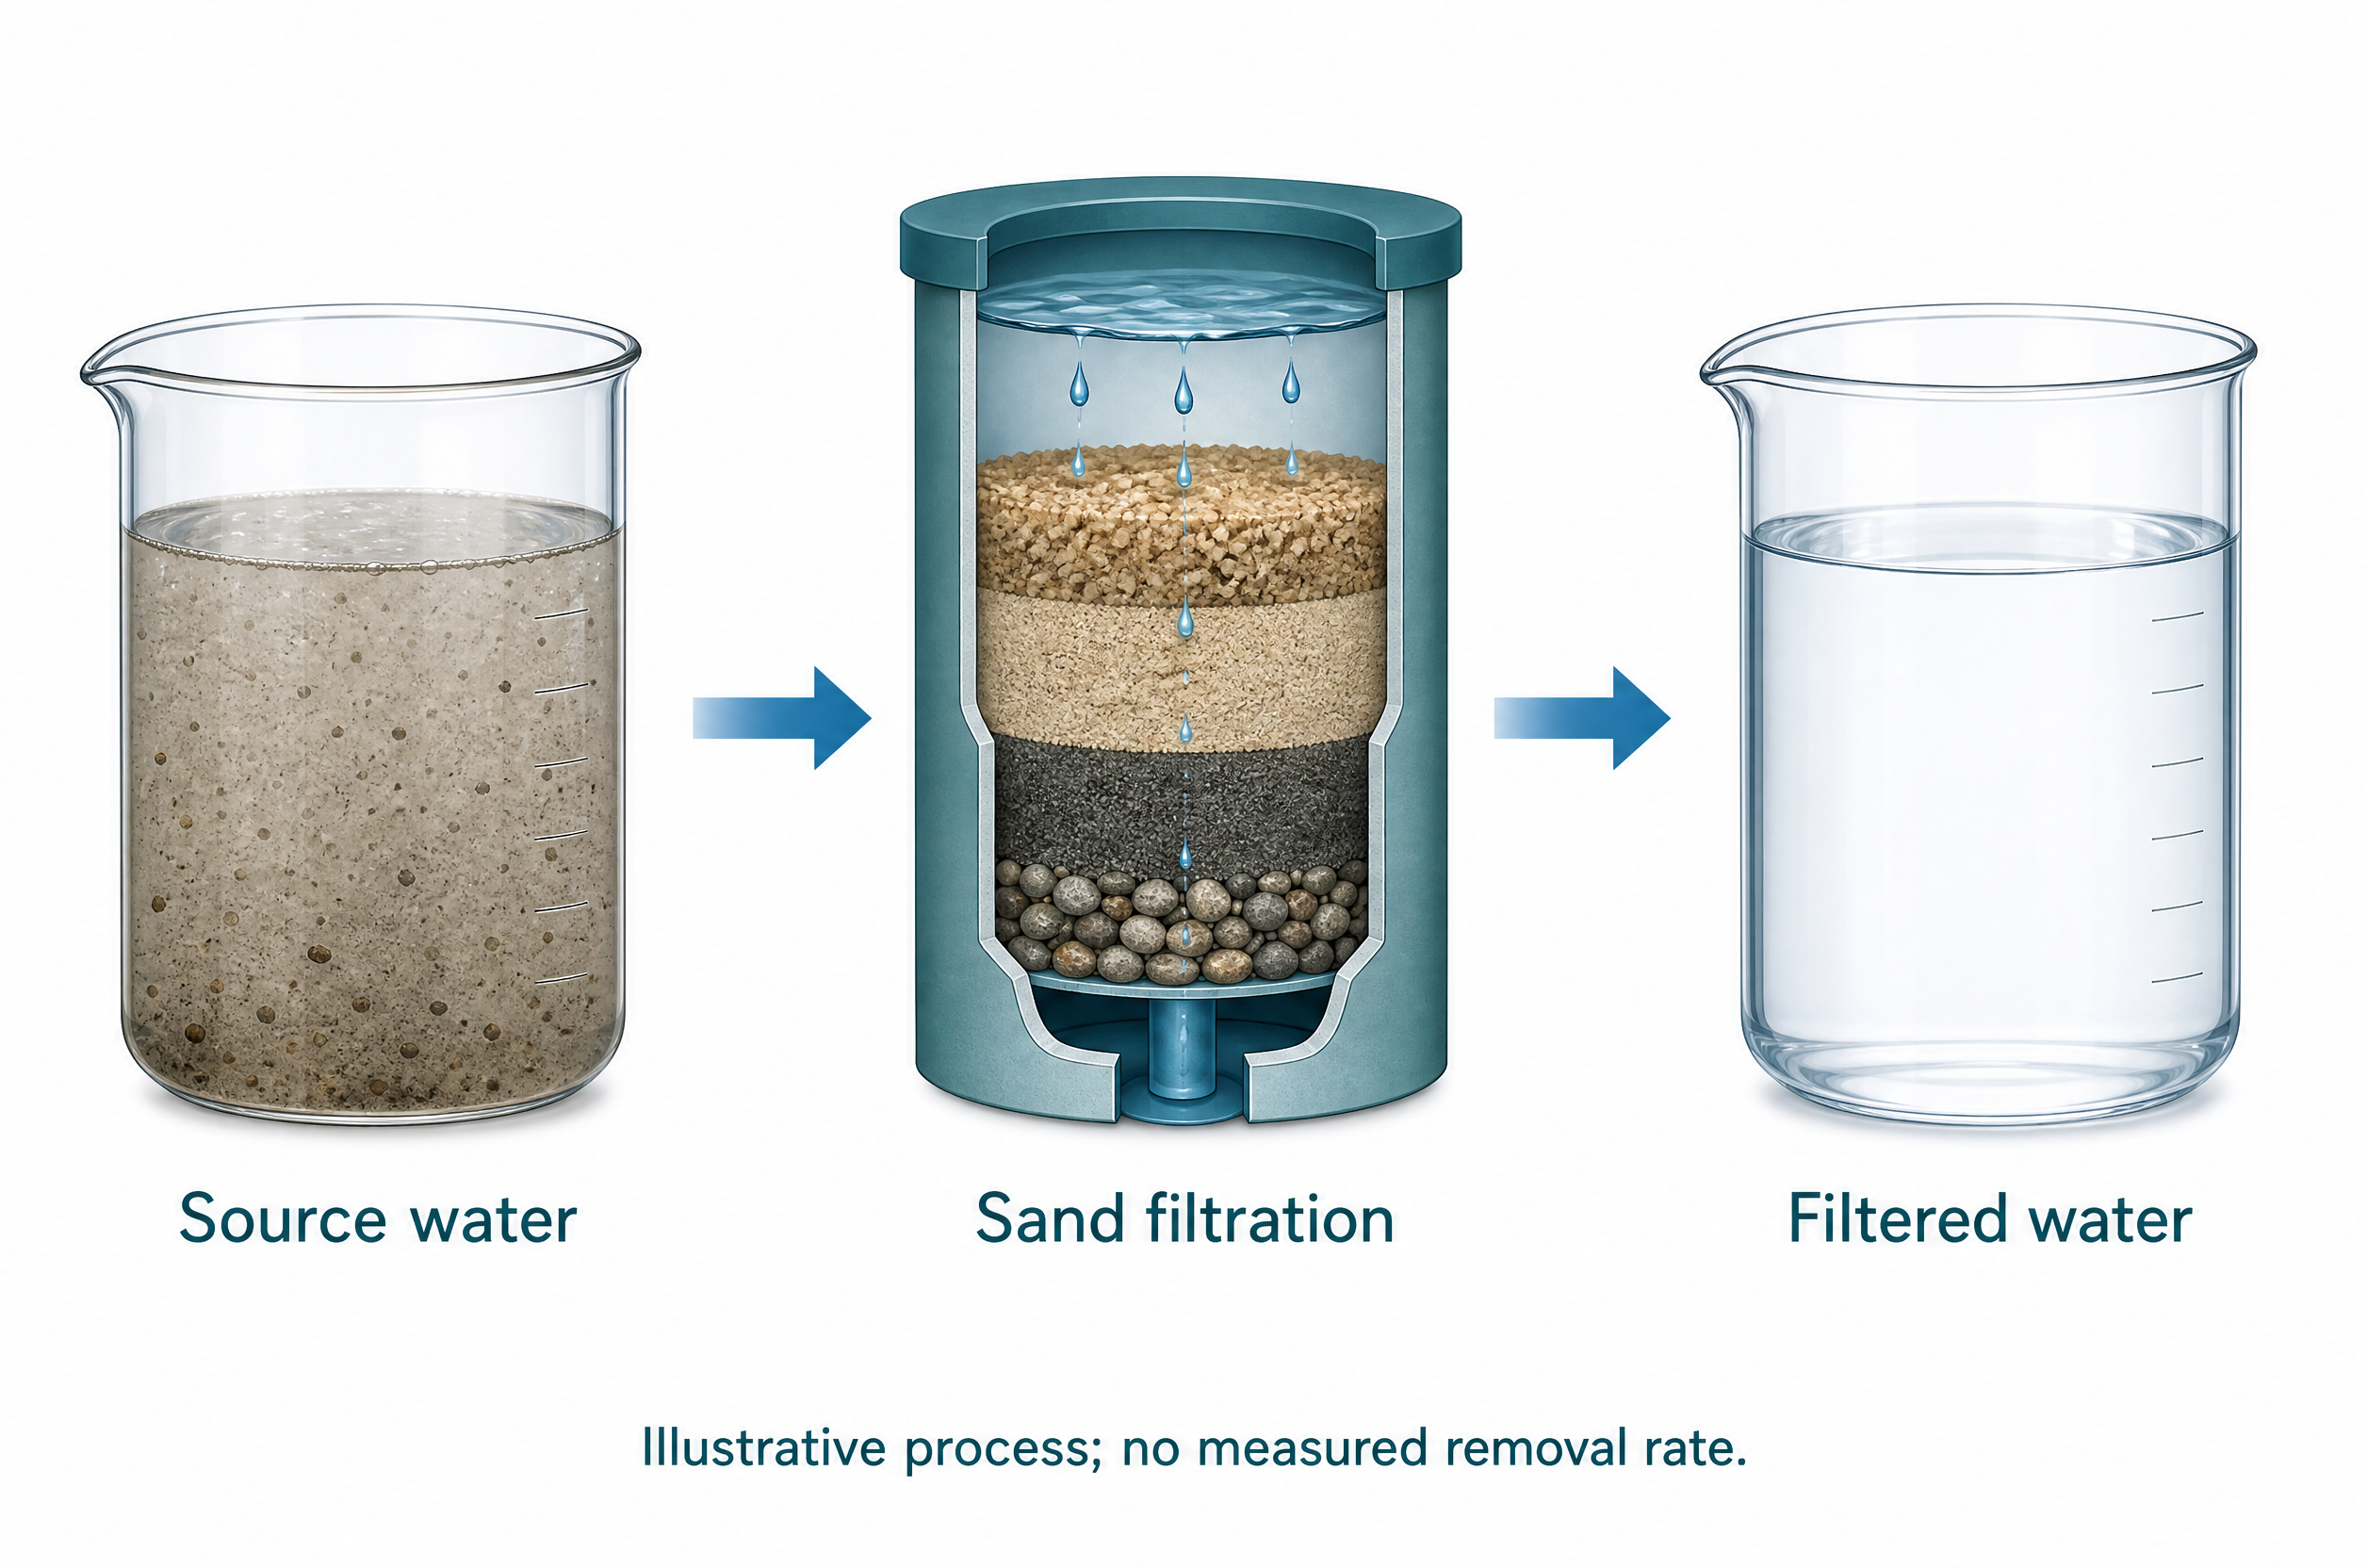
Use the Illustration example: source water → cutaway sand filter → filtered water. Image 2 2K, 3:2, 5 provider credits. Labels and footnote checked; a conceptual teaching image, not a filter design or safety claim.
Reviewed output · self-authored simulated inputMore reviewed outputs and model comparisons
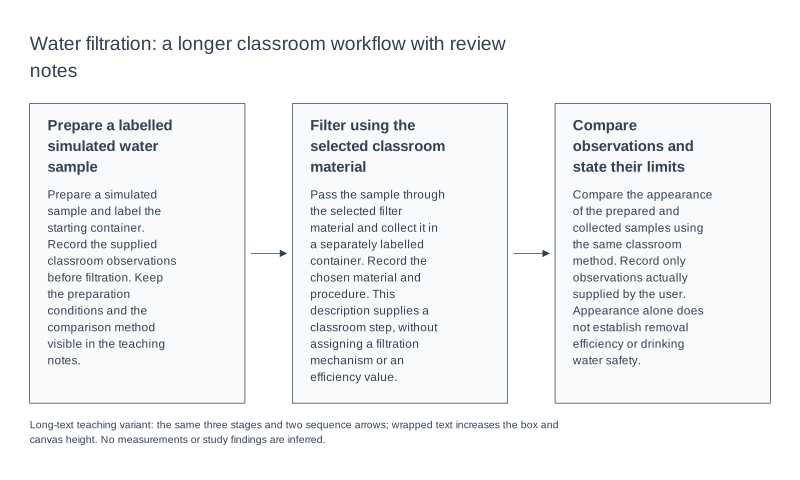
The long-text example uses the same three supplied stages and native arrows. Text wrapping grows the canvas; no removal efficiency or water safety claim is added.
Reviewed output · self-authored simulated input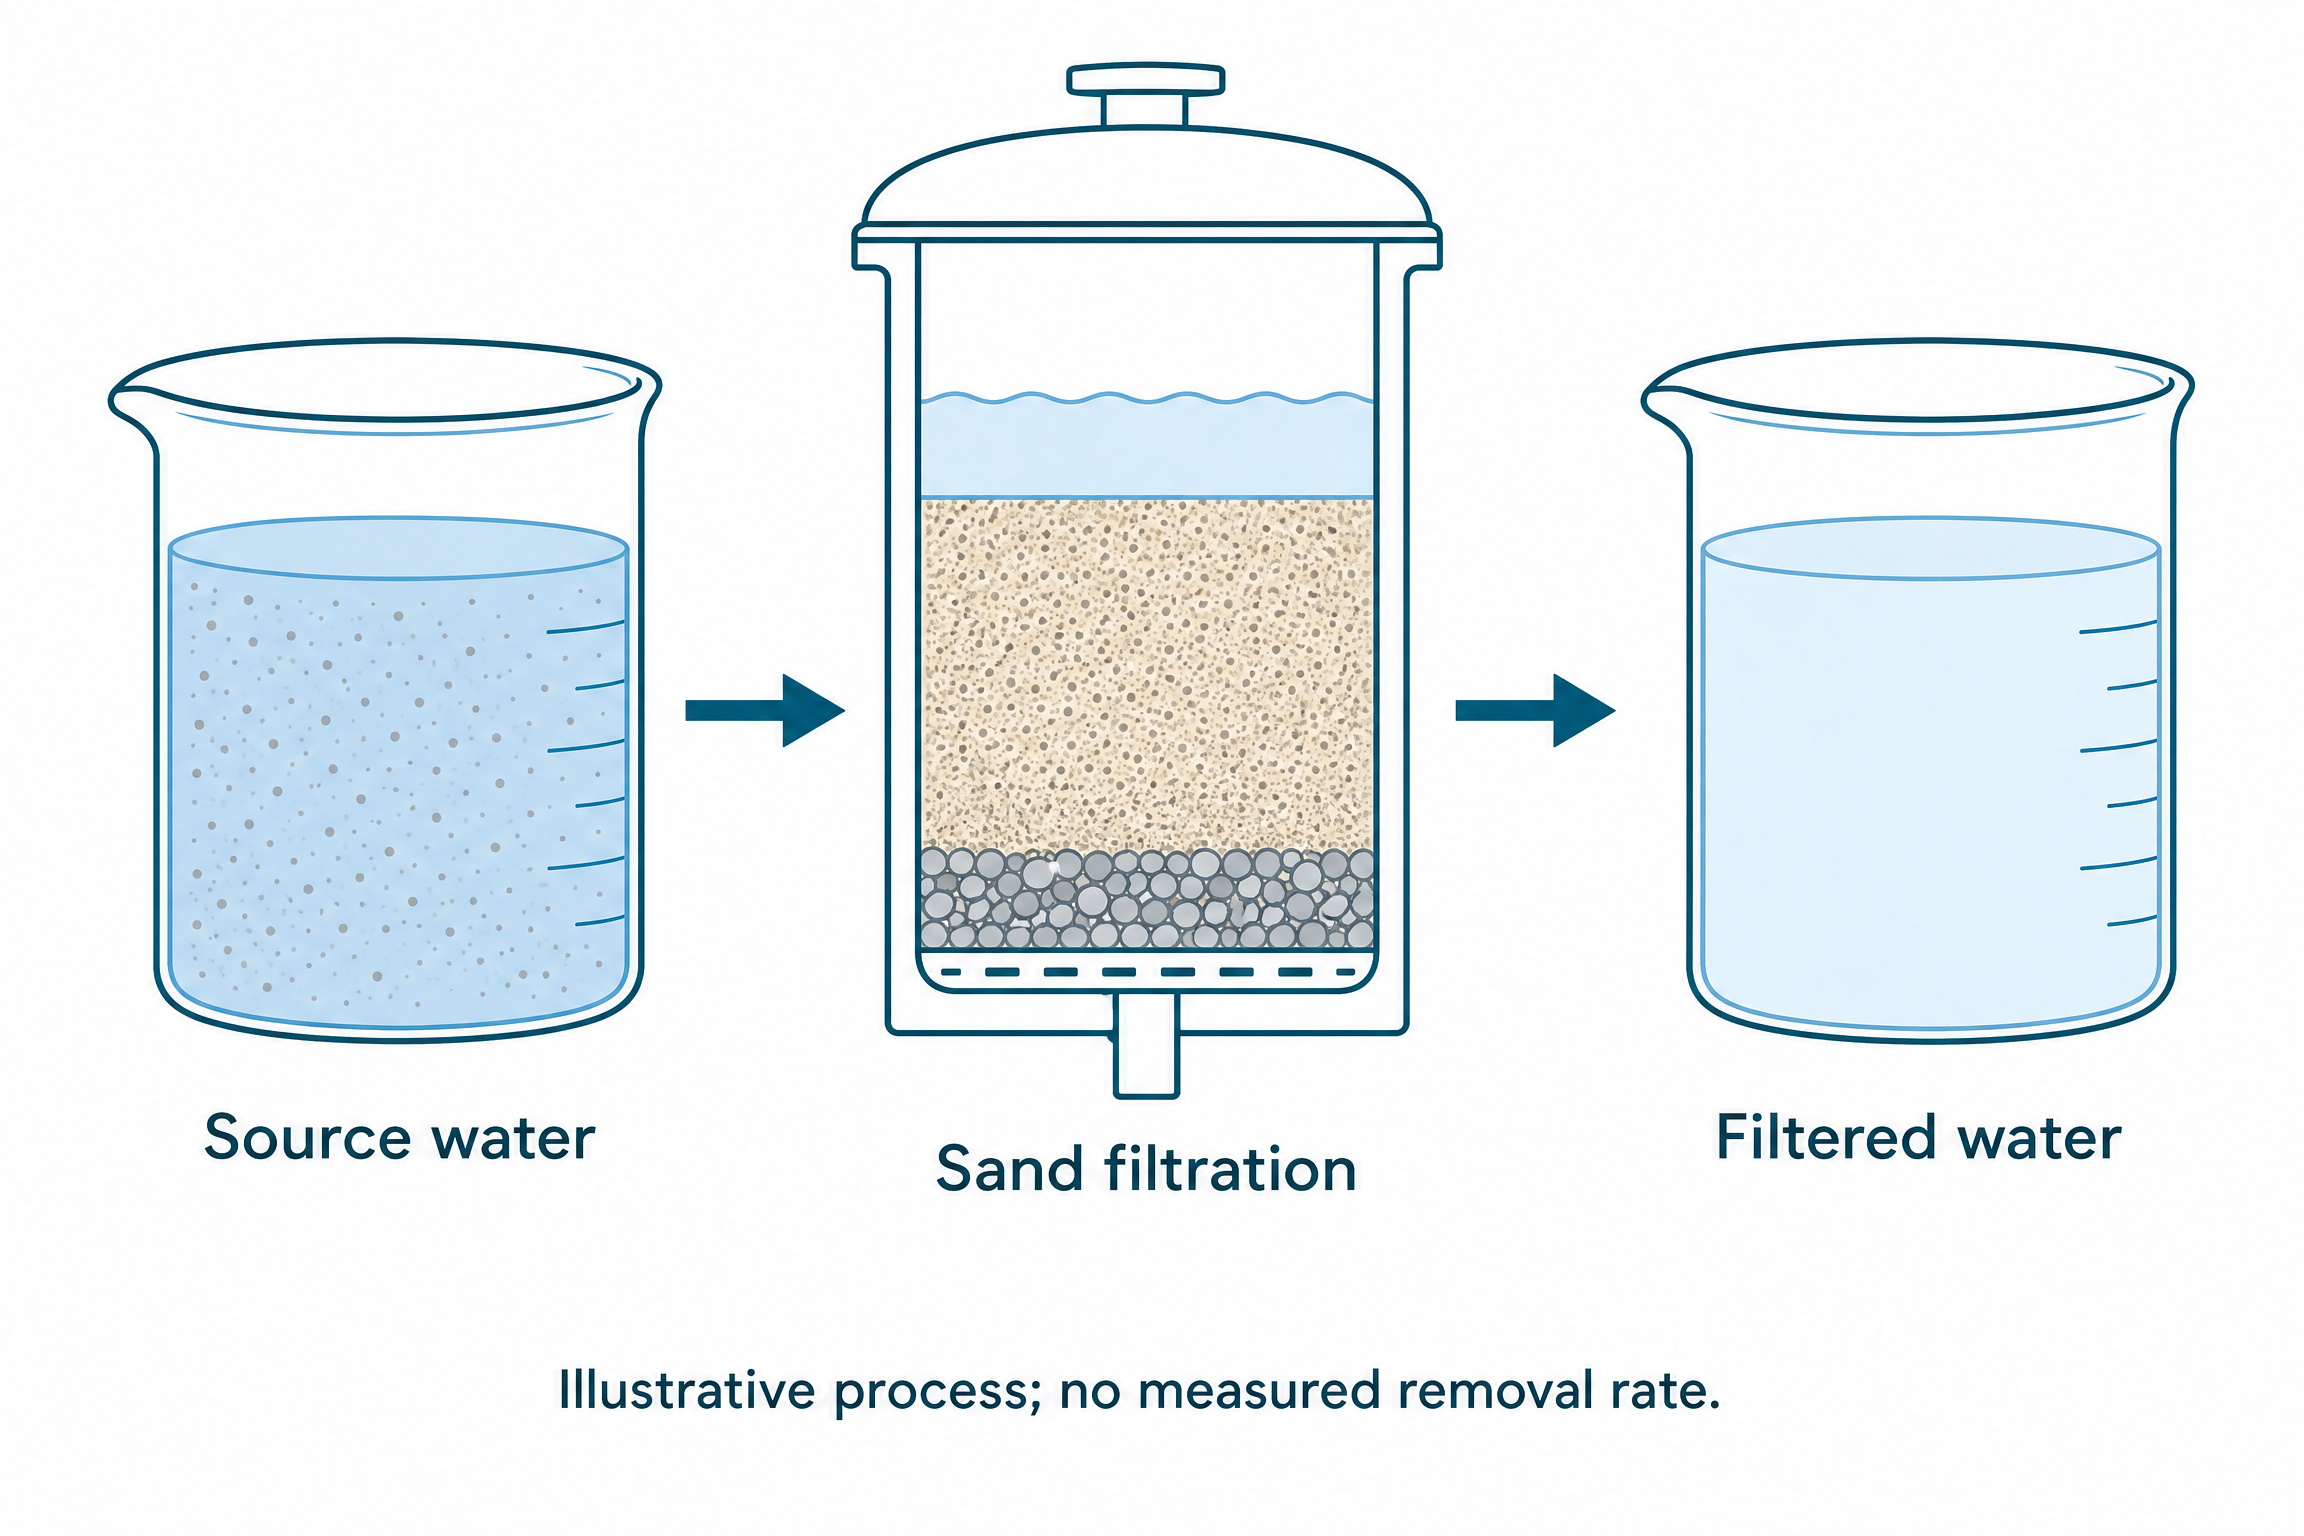
Self-authored test generated through this workers.dev preview, 2304×1536, 5 provider credits. Three labels and the exact footnote were checked. A conceptual filtration illustration, without measured removal efficiency or water safety claims.
Reviewed output · self-authored simulated input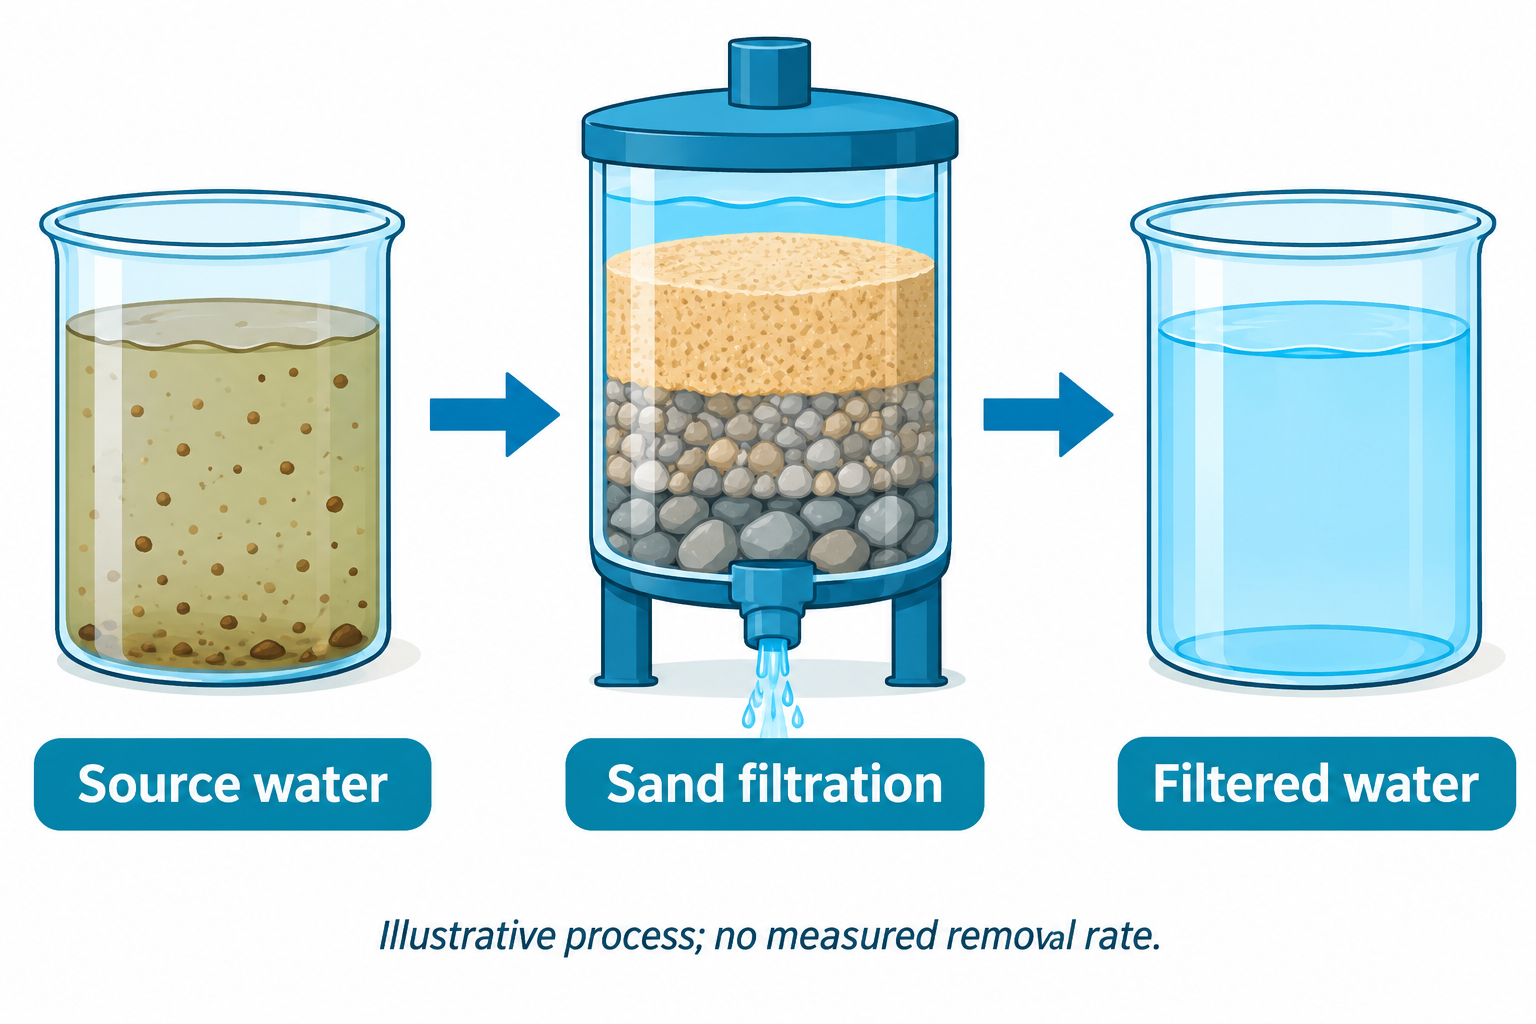
Archived self-authored model comparison, 1536×1024, 3 provider credits. Three stage labels and the footnote were checked. This earlier 1K probe is separate from the current 2K product route.
Reviewed output · self-authored simulated input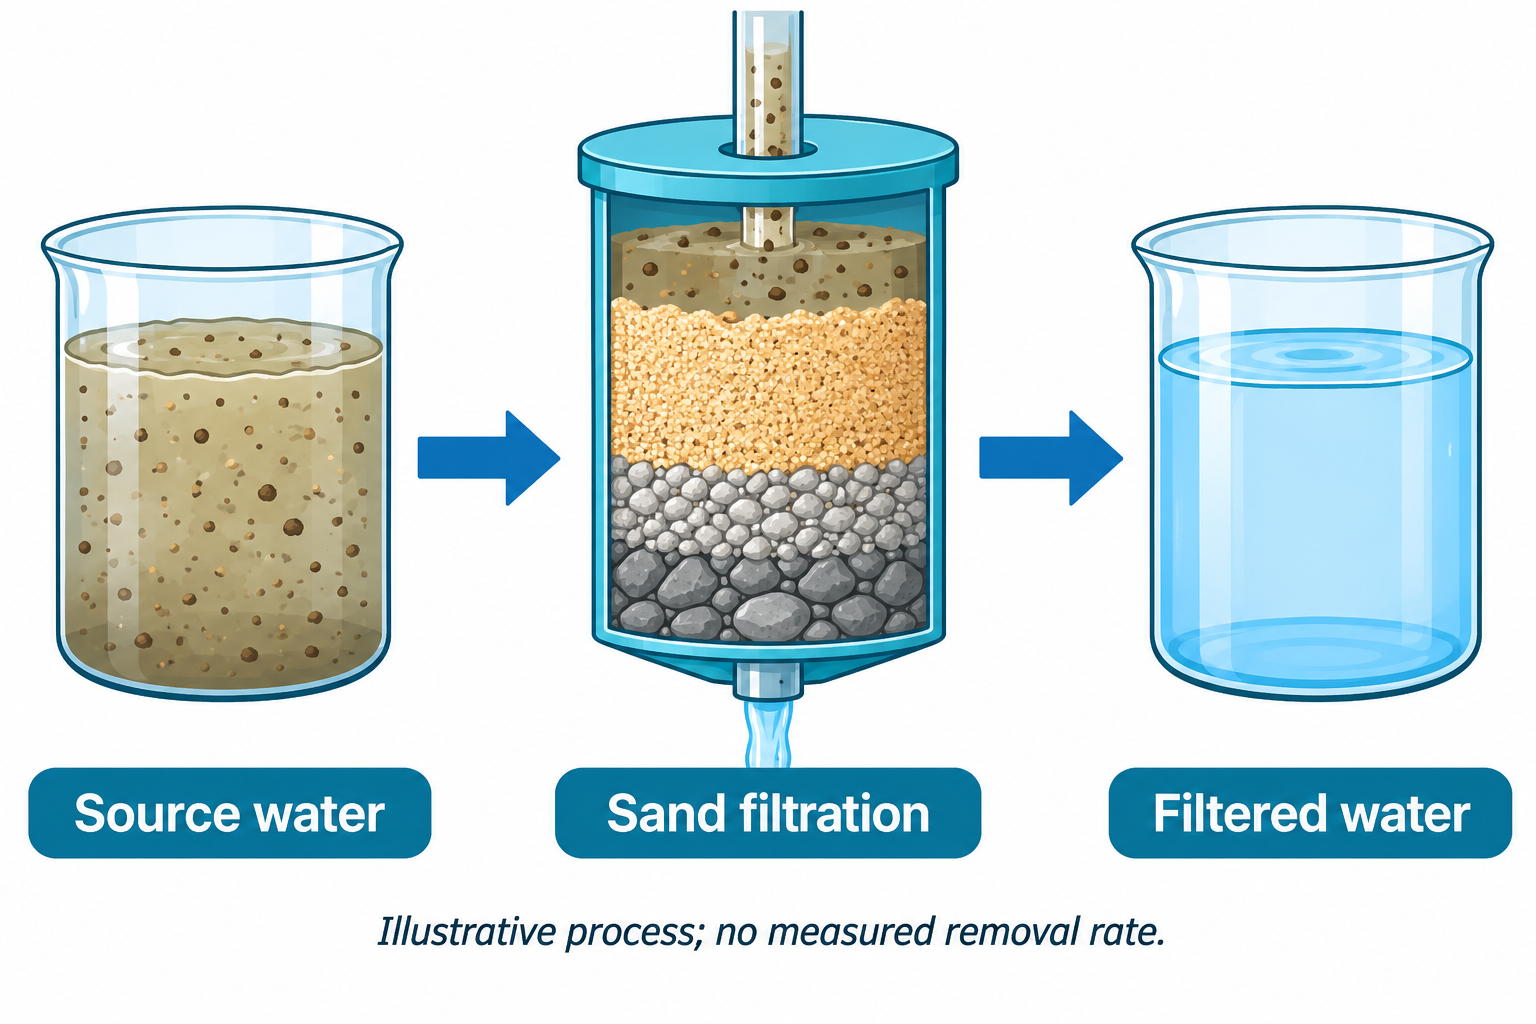
Archived Economy comparison, 1536×1024, 5 provider credits. The short English labels and footnote were checked. Economy is not offered as a product model switch.
Reviewed output · self-authored simulated input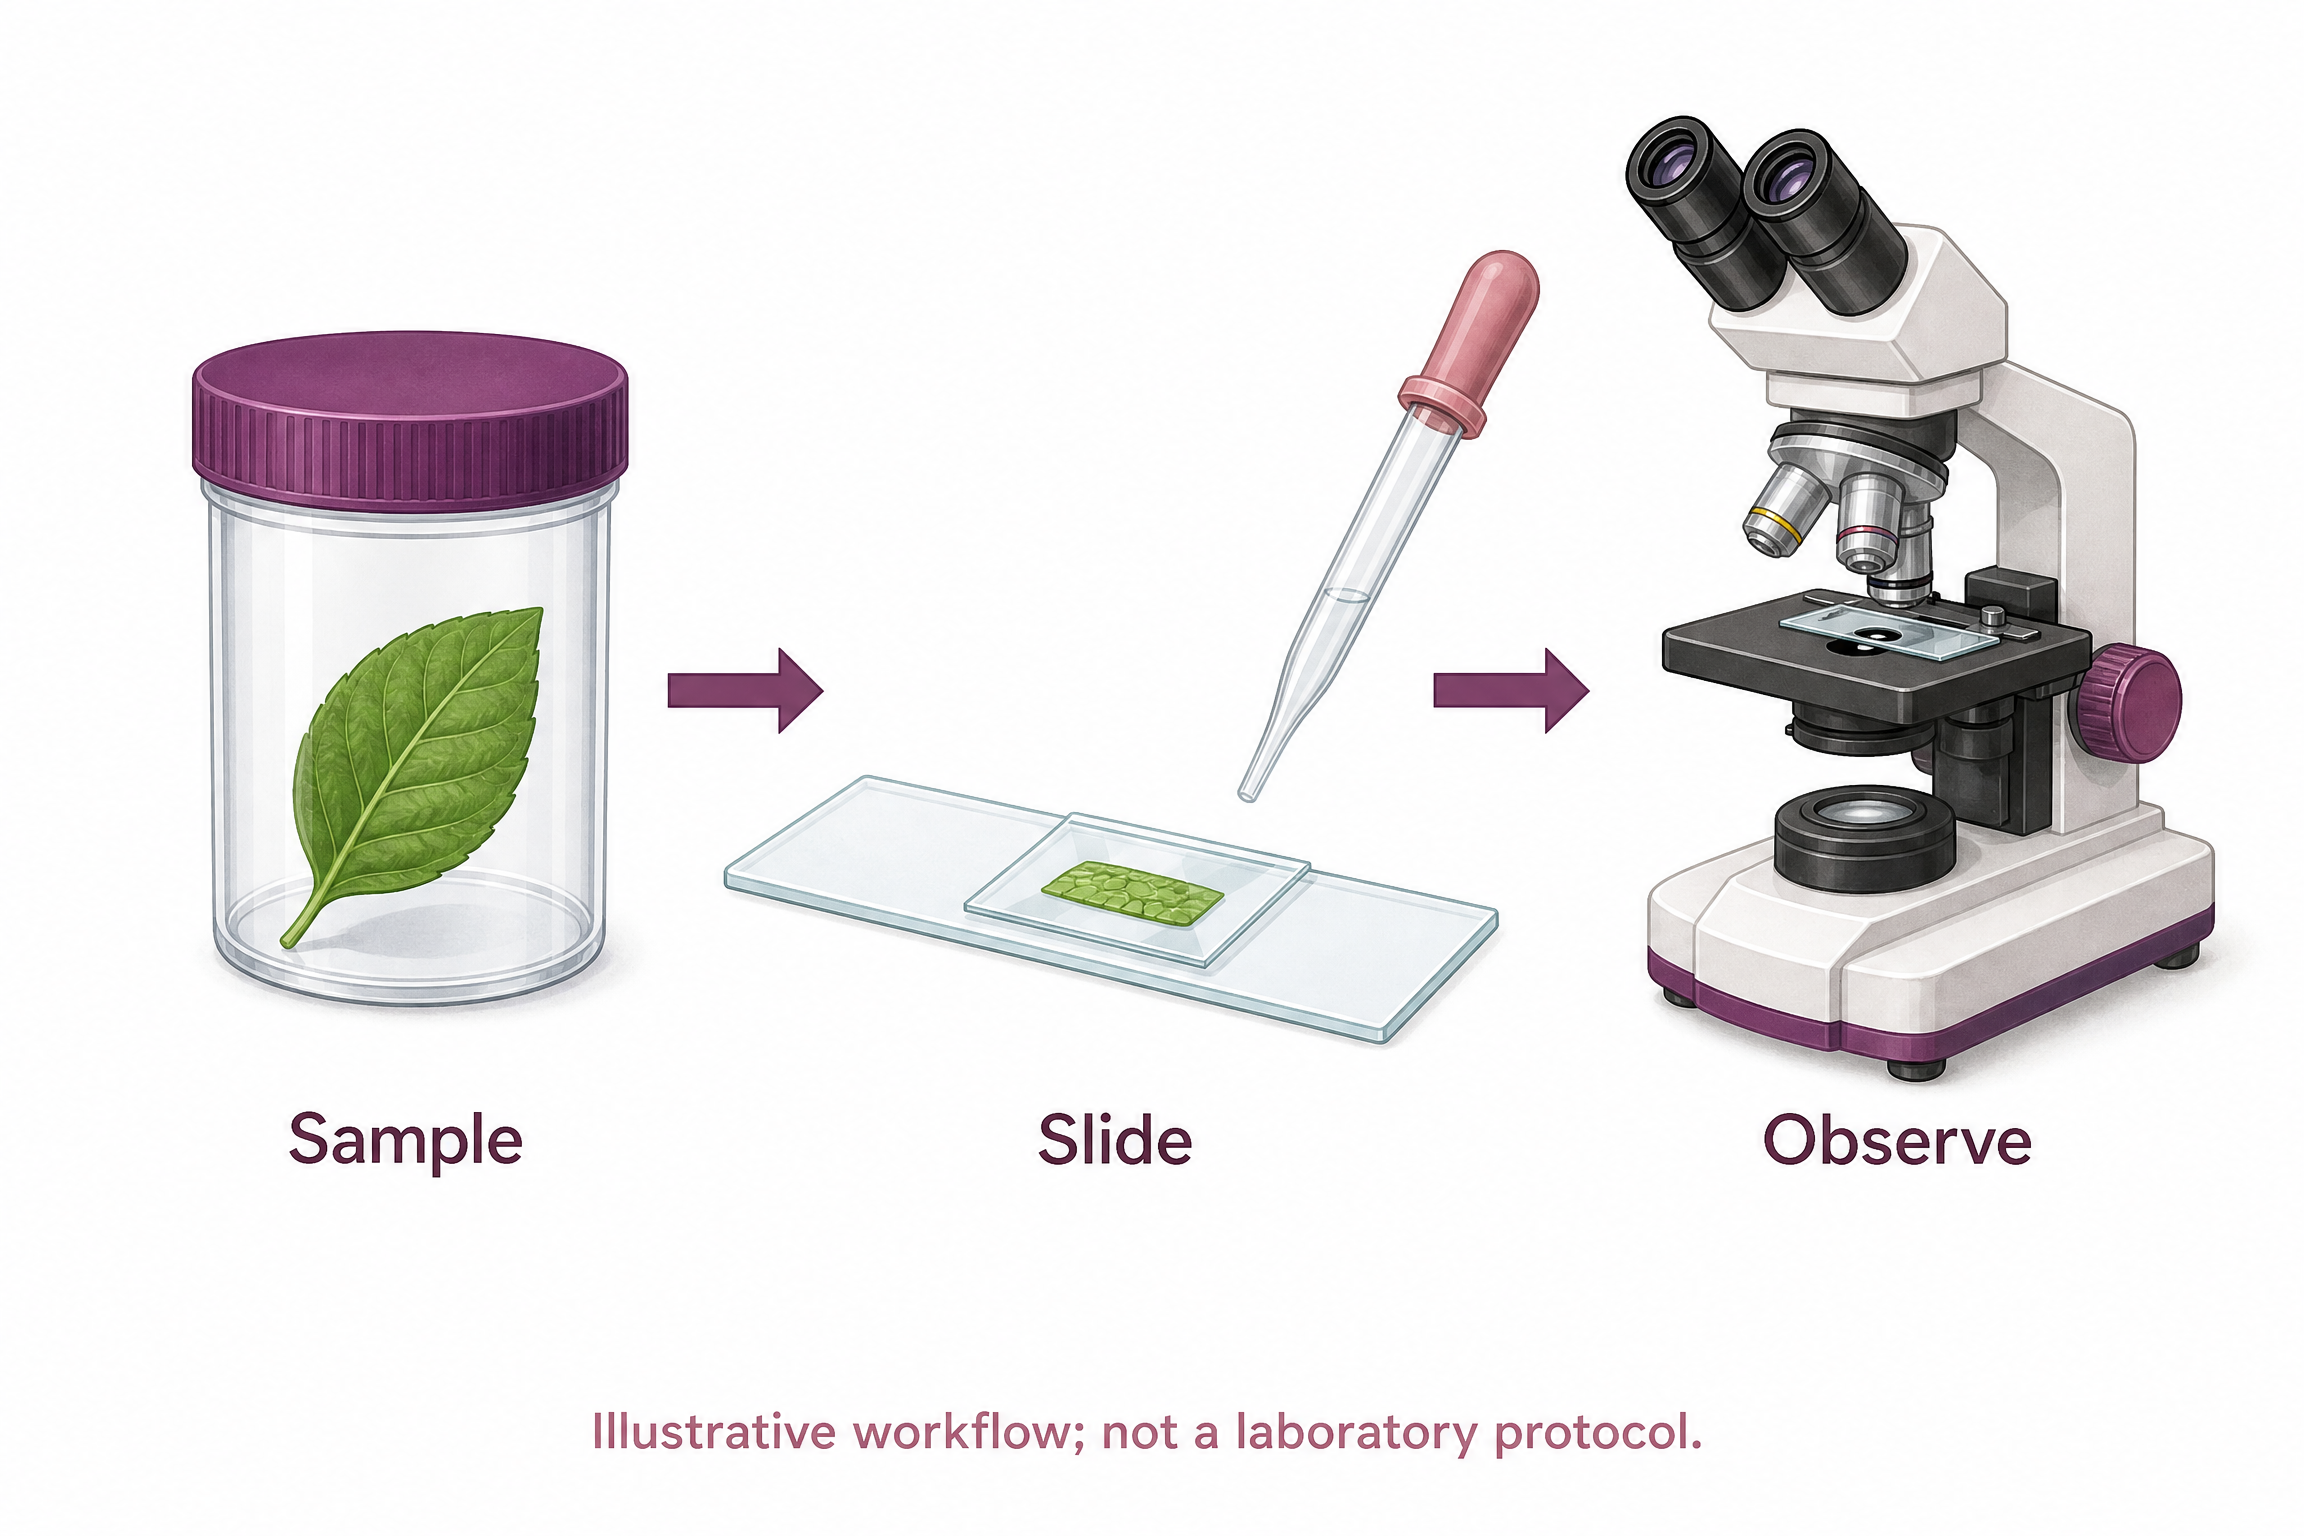
Self-authored account acceptance output, 2304×1536, 5 KIE credits and one product image credit. Three labels and exact footer checked. A conceptual illustration, not laboratory instructions or research evidence.
Reviewed output · self-authored simulated input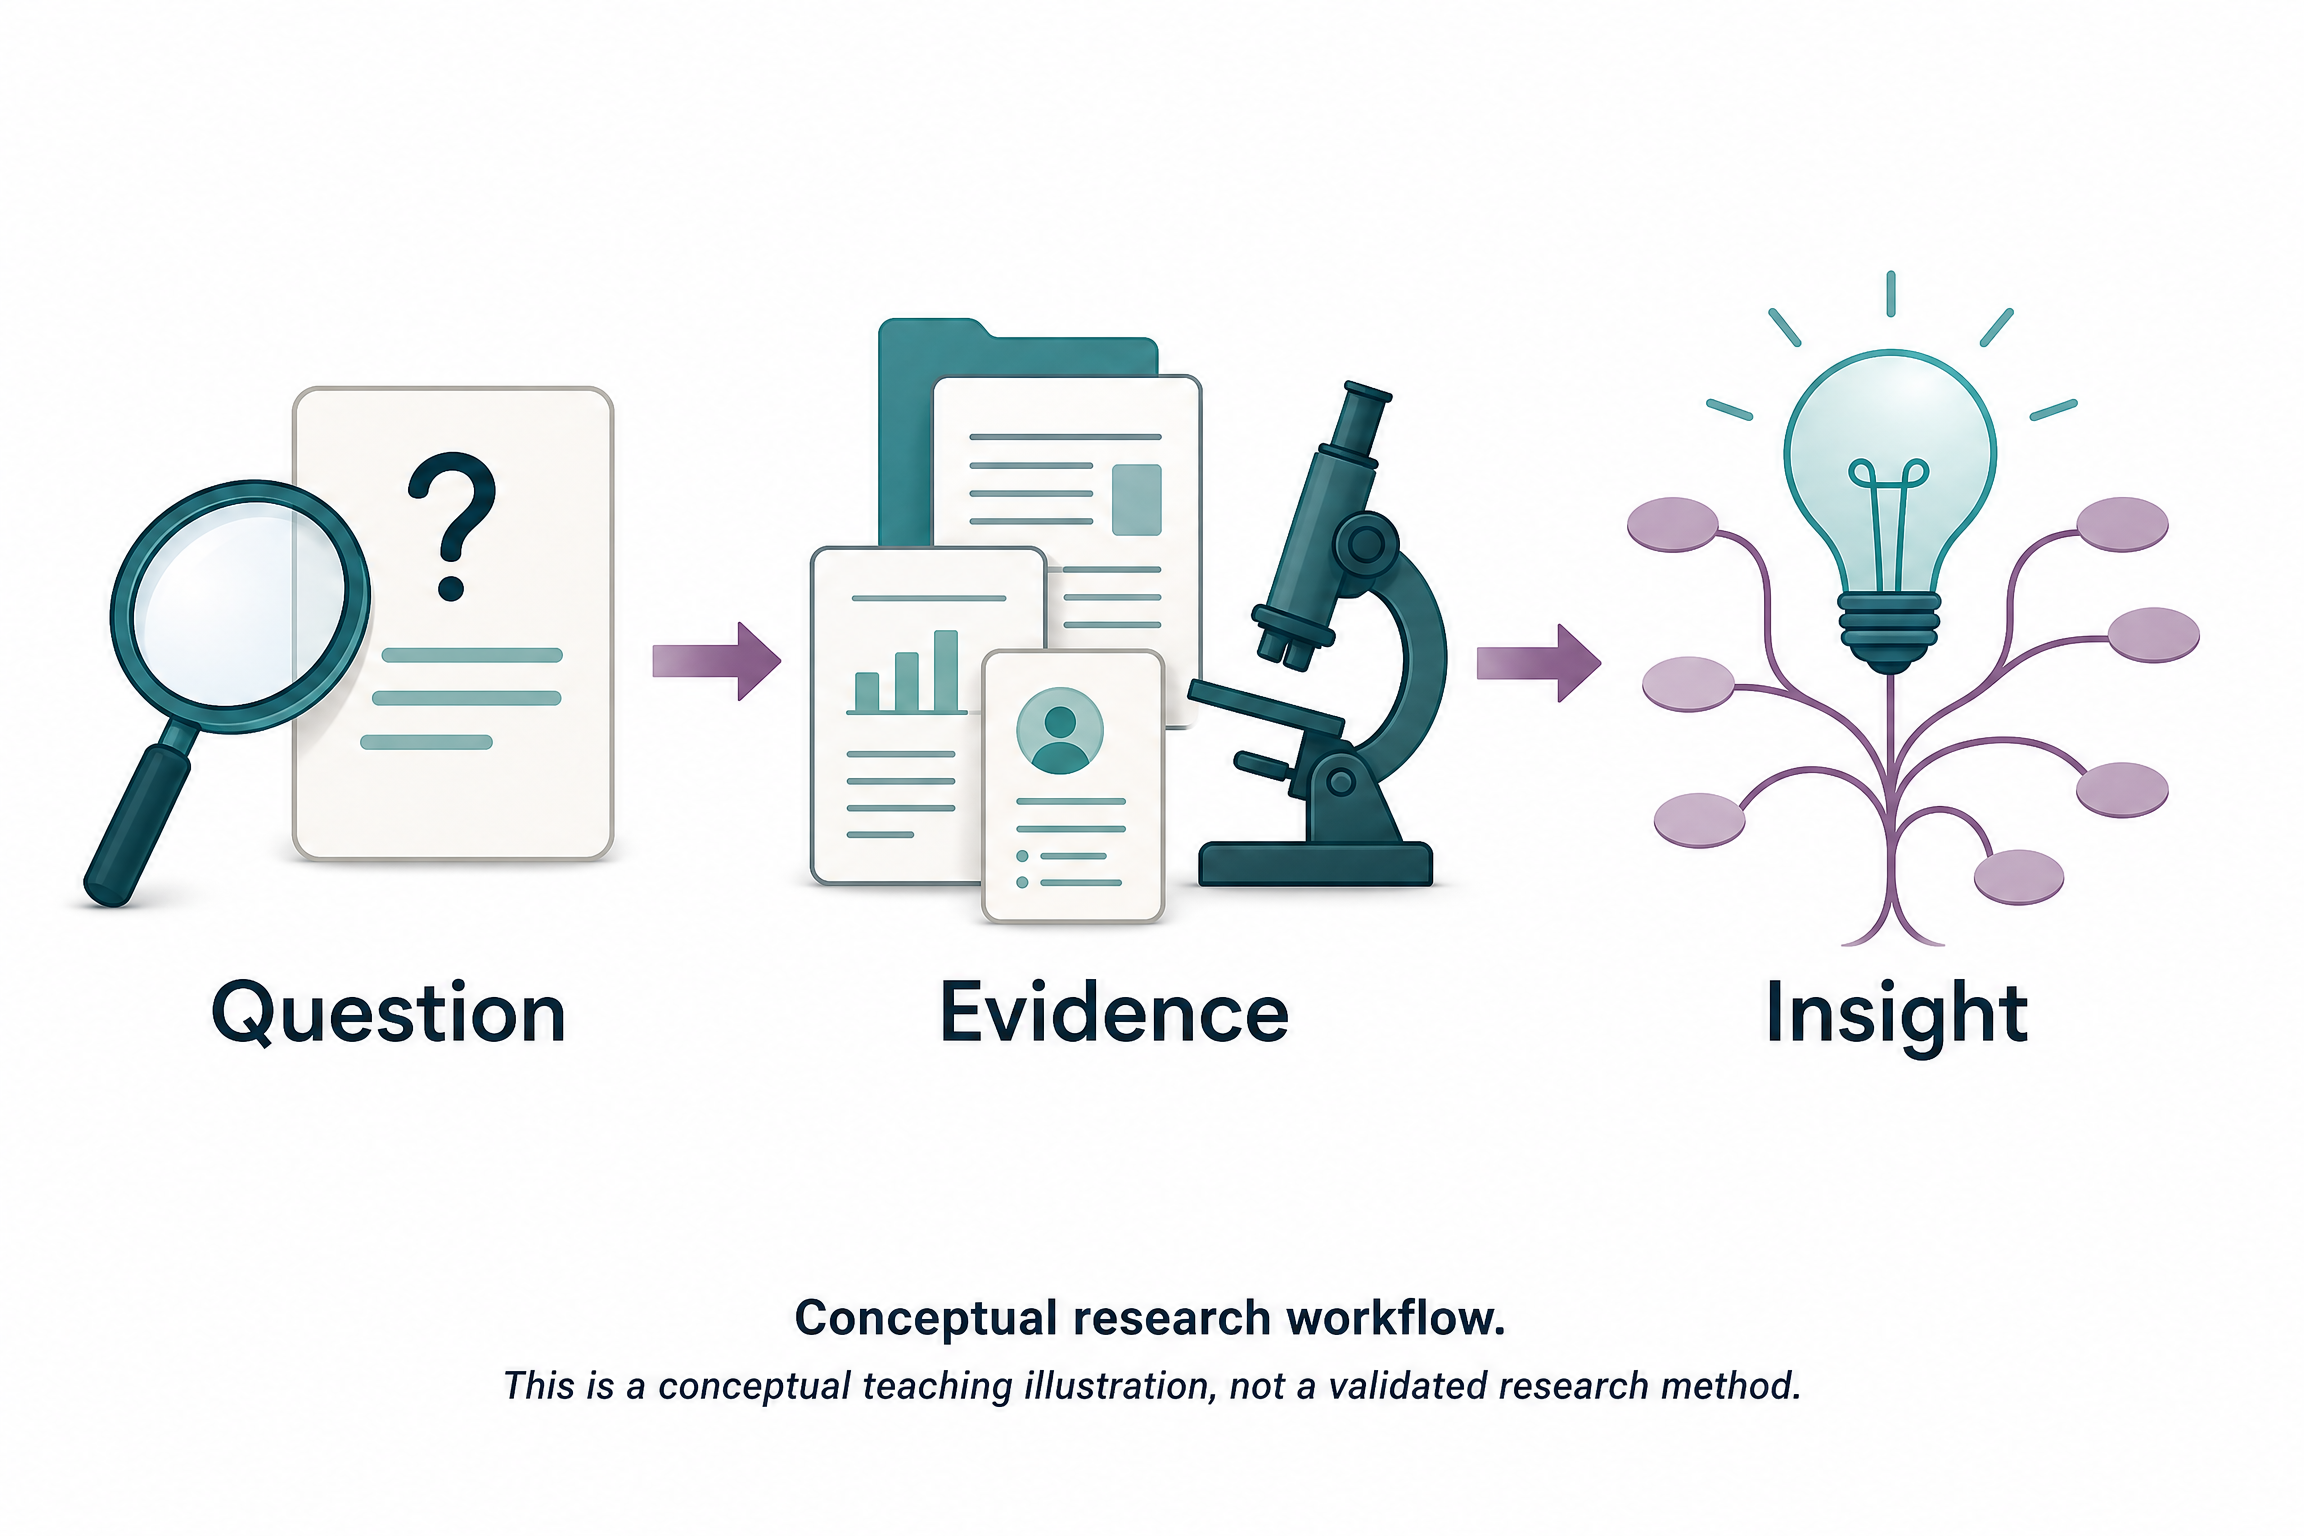
Self-authored verified-account acceptance output. The Question, Evidence and Insight labels were checked. A conceptual teaching illustration, without study results or a validated-method claim.
Reviewed output · self-authored simulated inputRead the example input
Title: Water filtration: a teaching workflow
1. Prepare — Prepare a simulated water sample.
2. Filter — Pass it through selected filter material.
3. Compare — Record appearance before and after.
Caption: Simulated teaching example; no removal efficiency or water safety claim.

Illustration: a separate scene with Source water, Sand filtration and Filtered water labels. The exact example brief is available inside Illustration mode.
Load the corresponding native example or use the Illustration example brief for a separate AI image. AI outputs vary between runs.
How the two graphical abstract modes work
Diagram mode draws 1–3 supplied stages as native text, boxes and sequence arrows. The AI input assistant may organize provided text into those fields; you review and apply its draft, then create the figure. It does not infer a complete mechanism or research result from an abstract.
Illustration is a separate Image 2 2K, 3:2 raster task. Its brief is sent to KIE, and the original image is saved in the private test workspace. Any words drawn in that image are pixels. Review the wording and scientific details; switching modes does not combine the image with native labels or arrows.
Two ways to build it
Diagram mode is available as a constrained three-stage arrangement using user-confirmed text, boxes, and arrows. Illustration mode is a separate AI bitmap workflow; the initial scope does not combine an AI image with an independent editable overlay.
What makes a good graphical abstract
A useful graphical abstract makes the study question, process, and main result legible at a glance. Keep each stage concise and ensure that arrows express relationships you intend; the tool should arrange a confirmed outline rather than invent a scientific mechanism.
Journal rules you should check first
Requirements for dimensions, permitted content, and AI disclosure vary by publication and can change. Check the target journal’s current instructions before preparing a submission; a generated draft does not establish that it meets those rules.
What’s vector and what’s bitmap
Diagram route uses native text and shapes, while Illustration produces a bitmap image. Text or labels rendered inside an illustration are pixels rather than separately editable text objects, even if the image is placed in a vector or presentation file.
How to use this tool
- Choose the output route for your task.
- Supply stage text for Diagram or a clear visual brief for Illustration.
- For AI-organized fields, review and apply the draft, then create the native diagram.
- For an illustration, submit once and inspect the returned words and scientific details.
- Download the supported format; check fonts, dimensions and reuse requirements.
Specifications and limits
- Modes
- Diagram and Illustration are available separately; mixed image/label composition remains a later version.
- Diagram
- 1–3 stages; title120, stage heading80/description360 and caption240 character limits. No automatic mechanism or measured-claim inference.
- Illustration
- Image 2 2K, 3:2, one image per request; current provider estimate5 credits (~$0.025). Private preview access and daily limits apply.
- Formats
- Diagram: native SVG/PPTX, PNG, basic-Latin vector PDF. Illustration: original raster PNG.
Guest native edits stay in this tab until you explicitly save a confirmed figure. Sign in to keep private works and revision history. Saved native works restore the figure and exports, not the original input form. AI tasks, images and references are private to their owner. Subscriptions and one-time packs are available for AI allowances. Native drawing and exports remain free. Understand export formats.
Frequently asked questions
What is the difference between Diagram and Illustration?
Diagram contains native text, boxes and arrows from confirmed stages. Illustration is a separate Image 2 2K bitmap; its labels remain pixels.
Can I combine an AI illustration with editable arrows?
Edit Diagram fields and create again, or revise the Illustration brief to generate a separate new image. Independent image/label overlays and reference-image editing are not included in this release.
Will the tool turn my full paper into a complete mechanism?
No. Diagram mode is intended for a concise outline whose stages and relationships you provide or confirm.
Can I edit text inside an illustration?
Edit Diagram fields and create again, or revise the Illustration brief to generate a separate new image. Independent image/label overlays and reference-image editing are not included in this release.
Will a journal accept my graphical abstract?
Acceptance depends on the journal's current size, content, and disclosure rules. Check the target journal requirements.
Can I use a reference image?
Reference-image upload and editing are not supported in this release. Illustration currently accepts a text brief and generates a separate Image 2 2K image.