
Inputs → figure
Kaplan–Meier Curve Generator
Create a Kaplan–Meier curve from event times and censoring indicators. Review the coding, groups, and risk counts before exporting the result.
Native rendering runs in this tab · AI submissions are stored separately
SVG and PPTX retain native text and shapes. PDF currently supports basic Latin text. Check font substitution in your editor.
Example input
Start with a reproducible example
Self-authored, simulated data for exploring this workflow. It is not a user’s research or a public gallery submission.
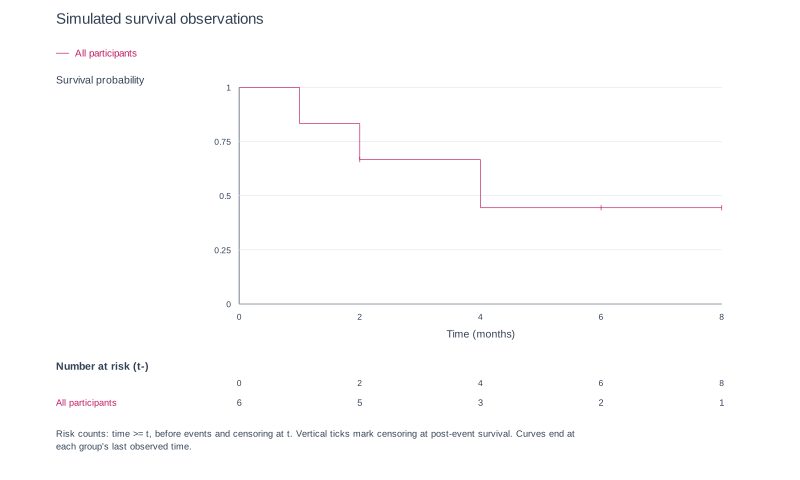
Use six synthetic participants with (time,event): (1,1), (2,0), (2,1), (4,1), (6,0), (8,0), in months. At risk at 0,2,4,6,8 is 6,5,3,2,1; time-2 events precede censoring.
Reviewed output · self-authored simulated input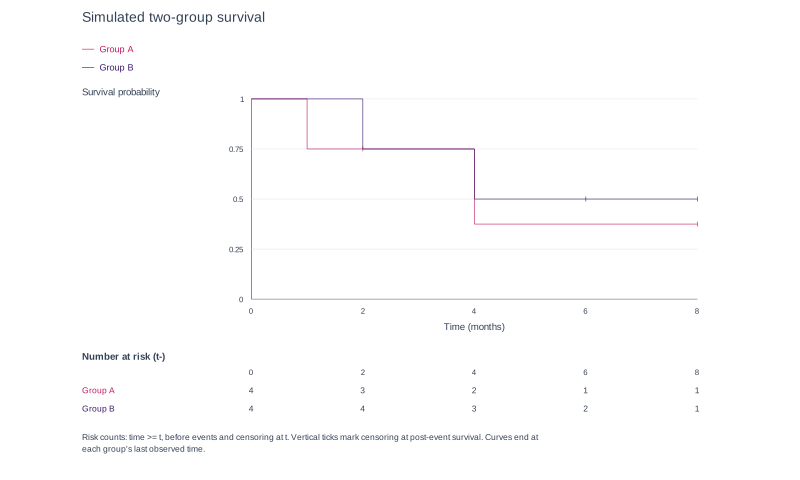
Use four participants in each of Group A and Group B from the two-group example: A=(1,1),(2,0),(4,1),(8,0); B=(2,1),(4,1),(6,0),(8,0). Show separate curves and t-minus risk counts at 0,2,4,6,8.
Reviewed output · self-authored simulated inputRead the example input
{
  "title": "Simulated survival observations",
  "timeLabel": "Time (months)",
  "riskTimes": "0,2,4,6,8",
  "csv": "participant,time,event\nP1,1,1\nP2,2,0\nP3,2,1\nP4,4,1\nP5,6,0\nP6,8,0"
}
Use Load example to recreate the native figure and inspect its text, shapes and source values.
How event and censoring data are used
The implementation calculates the Kaplan–Meier product-limit step estimate for right-censored participant observations. Each participant has one finite nonnegative time and an explicit indicator: 1 for the event and 0 for right censoring. Separate curves are calculated for supplied groups. At tied times, events are processed before censoring so both remain in the event risk set.
The optional number-at-risk table reports t-minus counts: participants with recorded time greater than or equal to each specified time, before events and censoring at that time. The tool does not calculate confidence intervals, log-rank tests, Cox models or adjusted analyses, and does not support left truncation, competing risks or interval censoring.
How the curve is estimated
The product-limit estimate uses one right-censored observation per participant, with event=1 and censoring=0. Events at a tied time are processed before censoring. A censor mark indicates an observation ending without the event; it does not create a survival drop.
Groups and numbers at risk
Supplied groups are calculated separately. The optional table counts participants whose observed time is at least t, before events and censoring at that time. Provide up to eight increasing risk-table times in the same unit as the participant times.
Checks and supported analyses
Checks cover CSV structure, unique participant IDs, finite nonnegative times, group labels and explicit 1/0 event coding. They do not audit survival-analysis assumptions. No confidence intervals, log-rank, Cox, adjusted, competing-risk, left-truncated or interval-censored analyses are included.
Export
The current implementation connects native SVG, PNG, PPTX and basic-Latin vector PDF; source CSV is also included. Review the final file and font substitution in your editor.
How to use this tool
- Paste participant,time,event CSV, optionally with a group column.
- Confirm event=1 and right-censored=0, and use one time unit throughout.
- Optionally enter up to eight strictly increasing risk-table times.
- Review step curves, censor marks, group labels and t-minus risk counts.
- Confirm Create and inspect the curve and source CSV.
Specifications and limits
- Input
- 1–500 participants; unique IDs; nonnegative times; event exactly 1 or 0; up to six groups
- Method
- Kaplan–Meier product-limit estimate for right censoring; tied events before censoring
- Risk table
- Optional, up to eight explicit times; time ≥ t before events/censoring at t
- Analysis boundary
- No inferred confidence intervals, log-rank, Cox, adjusted, competing-risk, left-truncation or interval-censoring analysis
- Formats
- Native SVG/PNG/PPTX/basic-Latin vector PDF and source CSV connected
Guest native edits stay in this tab until you explicitly save a confirmed figure. Sign in to keep private works and revision history. Saved native works restore the figure and exports, not the original input form. AI tasks, images and references are private to their owner. Subscriptions and one-time packs are available for AI allowances. Native drawing and exports remain free. Understand export formats.
Frequently asked questions
How should I code an event?
Use exactly 1 for an observed event and 0 for right censoring. Other coding and blank statuses are rejected; AI must not infer event status from an outcome name.
What time unit should I use?
Use one consistent time unit and state it in the required time-axis label. Times must be finite and nonnegative.
Can I compare groups?
You can display separate curves for up to six supplied groups. No group-comparison test is calculated.
How are numbers at risk calculated?
At each supplied t, the table counts observations with time ≥ t, before the events and censoring at t. At a tied event/censor time both observations are in the event risk set.
Does the generator run a log-rank test or Cox model?
No. Confidence intervals, log-rank tests, Cox models and adjusted analyses are not calculated.
Can I use the curve as my complete survival analysis?
No. This is a right-censored Kaplan–Meier plot. Review assumptions and analysis requirements separately; competing risks, left truncation and interval censoring are unsupported.