
Inputs → figure
Forest Plot Generator
Enter study effect sizes and confidence intervals to create a forest plot. Set the effect measure, review the axis, and export the chart and source data.
Native rendering runs in this tab · AI submissions are stored separately
SVG and PPTX retain native text and shapes. PDF currently supports basic Latin text. Check font substitution in your editor.
Example input
Start with a reproducible example
Self-authored, simulated data for exploring this workflow. It is not a user’s research or a public gallery submission.
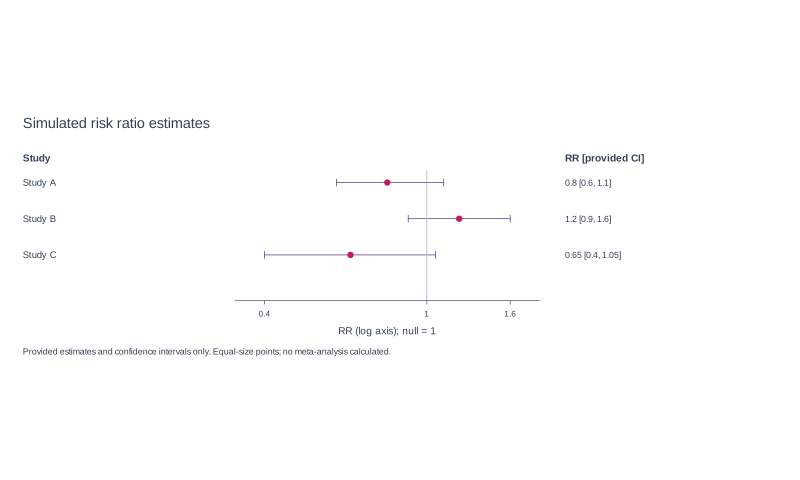
Use three supplied RR studies: Study A=0.8 [0.6,1.1], Study B=1.2 [0.9,1.6], Study C=0.65 [0.4,1.05]. Use a log axis and null=1; no pooling or weights.
Reviewed output · self-authored simulated input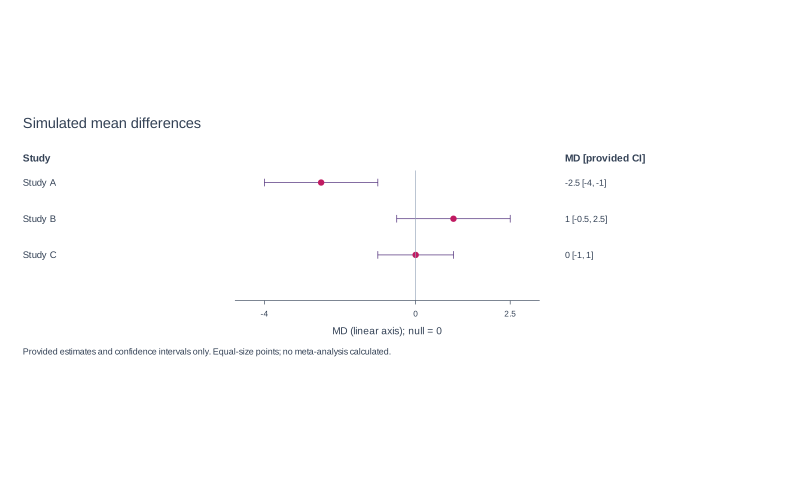
Use three supplied MD studies: Study A=-2.5 [-4,-1], Study B=1 [-0.5,2.5], Study C=0 [-1,1]. Use a linear axis and null=0; no pooled estimate.
Reviewed output · self-authored simulated inputRead the example input
{
  "title": "Simulated risk ratio estimates",
  "measure": "RR",
  "csv": "study,effect,lower,upper\nStudy A,0.8,0.6,1.1\nStudy B,1.2,0.9,1.6\nStudy C,0.65,0.4,1.05"
}
Use Load example to recreate the native figure and inspect its text, shapes and source values.
How study estimates become a forest plot
The implementation plots supplied study estimates and confidence limits without deriving them from observations. RR, OR and HR use a logarithmic axis with null value 1 and require positive estimates and bounds. MD and SMD use a linear axis with null value 0. The supplied lower bound must not exceed the estimate, and the estimate must not exceed the upper bound.
All studies must use the same effect measure and a consistent user-specified confidence level. The display uses equal-size points and does not calculate study weights, pooled estimates, confidence intervals or heterogeneity. AI only extracts supplied rows for review.
Effect measures and reference lines
RR, OR and HR use a log axis with null 1; every estimate and bound must be positive. MD and SMD use a linear axis with null 0. All rows must share the selected measure and a consistent supplied confidence level.
What we validate
CSV structure, unique study labels and finite supplied estimates are checked. Each interval must satisfy lower ≤ estimate ≤ upper. Blank values and mixed measures block creation; intervals are not repaired or calculated.
What this tool does not calculate
The chart displays supplied estimates and confidence limits. It does not calculate study weights, a pooled effect, I-squared, derived confidence intervals or other meta-analysis statistics.
Export and source data
The current implementation connects native SVG, PNG, PPTX and basic-Latin vector PDF; source CSV is also included. Review the final file and font substitution in your editor.
How to use this tool
- Paste CSV with study,effect,lower,upper columns.
- Select the supplied effect measure: RR, OR, HR, MD or SMD.
- Check a consistent confidence level and one measure across all rows.
- Review supplied endpoints and the automatic measure-specific axis and null line.
- Confirm Create and inspect the plot and source CSV.
Specifications and limits
- Input
- 1–50 unique study labels with supplied effect and lower/upper confidence limits
- Axis
- RR/OR/HR: positive values, log axis, null 1; MD/SMD: linear axis, null 0
- Statistics
- Provided estimates only; no weights, pooling, derived intervals or heterogeneity
- Formats
- Native SVG/PNG/PPTX/basic-Latin vector PDF and source CSV connected
Guest native edits stay in this tab until you explicitly save a confirmed figure. Sign in to keep private works and revision history. Saved native works restore the figure and exports, not the original input form. AI tasks, images and references are private to their owner. Subscriptions and one-time packs are available for AI allowances. Native drawing and exports remain free. Understand export formats.
Frequently asked questions
What data do I need?
Provide a unique study label, effect estimate, lower and upper confidence limits, and select the supplied effect measure. Use one confidence level across studies.
Which effect measures are supported?
RR, OR and HR use a log axis with null 1. MD and SMD use a linear axis with null 0. Do not mix measures across rows.
Does this perform a meta-analysis?
No. It plots supplied estimates and intervals with equal-size points; it does not calculate a pooled analysis.
Will it calculate study weights or I-squared?
No study weights, I-squared or heterogeneity statistics are calculated.
Why does the axis depend on the measure?
Ratios use a log scale and null 1; differences use a linear scale and null 0. The selected measure must match every input row.
Can I move a point in the exported chart?
Change an estimate by editing the source row and creating the plot again. Moving a native object in an external editor can break its correspondence with the supplied data.