
Inputs → figure
Punnett Square Generator
Choose parent genotypes to create a Punnett square and calculate genotype and phenotype proportions under the selected inheritance assumptions.
Native rendering runs in this tab · AI submissions are stored separately
SVG and PPTX retain native text and shapes. PDF currently supports basic Latin text. Check font substitution in your editor.
Example input
Start with a reproducible example
Self-authored, simulated teaching input for exploring this workflow. It is not a user’s research or a public gallery submission.
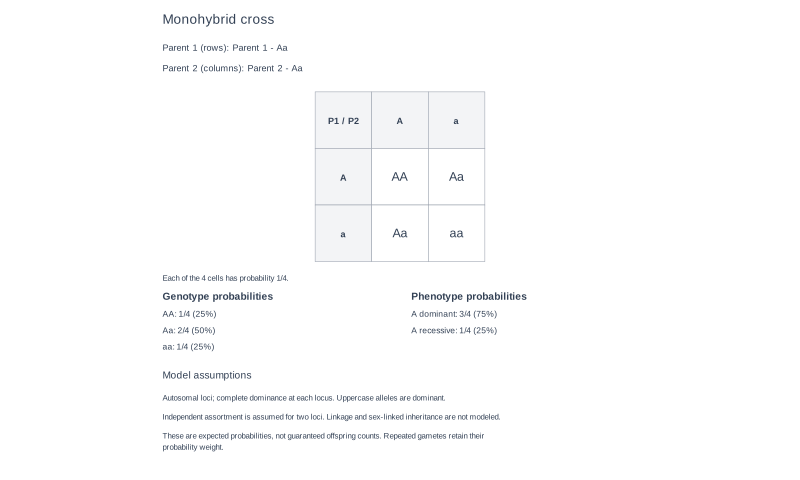
Use Aa × Aa under complete dominance.
Reviewed output · self-authored simulated input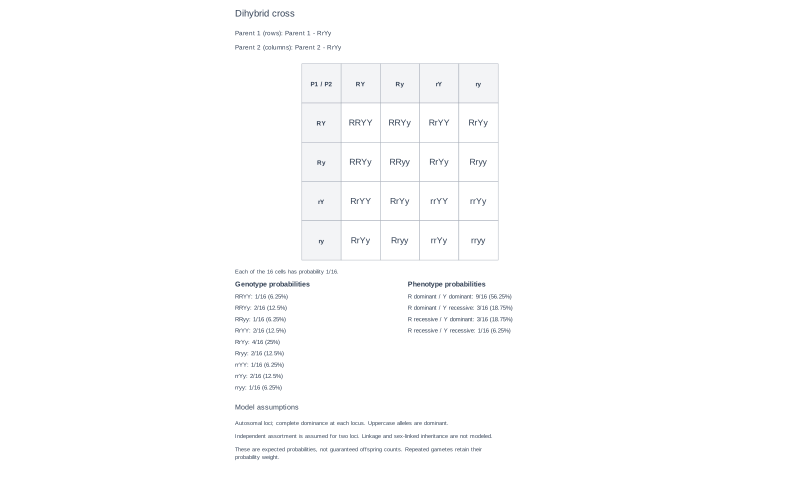
Use RrYy × RrYy under independent assortment and complete dominance.
Reviewed output · self-authored simulated inputRead the example input
Cross type: Dihybrid
Trait 1: Seed shape; R = round, r = wrinkled
Trait 2: Seed color; Y = yellow, y = green
Parent 1 genotype: RrYy
Parent 2 genotype: RrYy
Assumptions: Complete dominance; independent assortment
Use Load example to recreate the native figure and inspect its text, shapes and source values.
How the cross and proportions are derived
The generator enumerates each parent’s allele combinations into a 2×2 monohybrid or 4×4 dihybrid grid, retaining repeated gametes and their probability weights. It then counts genotype and phenotype probabilities. The current fixed model assumes autosomal loci, complete dominance and, for two loci, independent assortment.
The initial model assumes complete dominance where specified and independent assortment for the dihybrid target. These assumptions do not cover every inheritance pattern. Sex linkage, linkage between genes, incomplete dominance, and other cases are not implied unless separately implemented and validated.
How to read the ratios
Each grid cell represents one possible combination of parental gametes under the selected model. Genotype proportions come from counting the resulting combinations; phenotype proportions additionally depend on the trait definitions and dominance rules entered for the cross.
Monohybrid vs dihybrid
A single-gene cross uses a 2×2 grid, while a two-gene cross uses a 4×4 grid. The dihybrid model assumes independent assortment, so its proportions should not be generalized to linked genes or other inheritance patterns.
Classroom use
A square can help explain how a stated inheritance model produces possible offspring genotypes, but it is not a prediction of an individual outcome. Check allele notation, parental genotypes, dominance assumptions, and any classroom instructions before distributing a generated worksheet.
How to use this tool
- Enter each parent’s genotype, such as Aa or RrYy.
- Add the figure title and parent labels.
- Read the fixed dominance and assortment assumptions.
- Create the square, then inspect every gamete and probability.
- Export the confirmed figure in a supported format.
Specifications and limits
- Crosses
- One-locus 2×2 or two-locus 4×4; both parents must contain the same loci.
- Model
- Autosomal loci, complete dominance; independent assortment for two loci. Expected probabilities, not guaranteed offspring counts.
- Results
- Every gamete combination, genotype counts/proportions and dominant/recessive phenotype probabilities.
- Out of scope
- Sex linkage, linked genes, incomplete dominance and codominance are not supported.
- Formats
- Native SVG/PPTX, PNG and basic-Latin vector PDF. AI can organize supplied genotypes into an unconfirmed draft.
Guest native edits stay in this tab until you explicitly save a confirmed figure. Sign in to keep private works and revision history. Saved native works restore the figure and exports, not the original input form. AI tasks, images and references are private to their owner. Subscriptions and one-time packs are available for AI allowances. Native drawing and exports remain free. Understand export formats.
Frequently asked questions
Can it make a dihybrid Punnett square?
Yes. Enter two matching loci in both parents, such as RrYy and RrYy. The 4×4 square assumes independent assortment and complete dominance.
How are genotype proportions calculated?
Each cell retains its equally weighted gamete combination, including repeated homozygous gametes. Identical offspring genotypes are counted and divided by 4 or 16.
How are phenotype proportions determined?
Uppercase alleles are treated as dominant. Phenotypes are reported as dominant/recessive states at each locus, under the fixed model; trait names and medical outcomes are not inferred.
Does it support sex-linked traits?
No. Sex linkage and linked-gene notation are not supported in this version.
Does a dihybrid cross assume independent assortment?
The planned basic model does. That assumption should be shown and should not be treated as universal biology.
Can I print the square for class?
Export SVG, PNG, native PPTX or basic-Latin vector PDF, then inspect the actual file before printing.