
Inputs → figure
Water Cycle Diagram Generator
Create an AI surface water cycle diagram with supplied stores, process labels and arrows. Review evaporation, condensation, precipitation and runoff, then download PNG.
Checking AI availability…
Example input
Start with a reproducible example
Self-authored, simulated teaching input for exploring this workflow. It is not a user’s research or a public gallery submission.
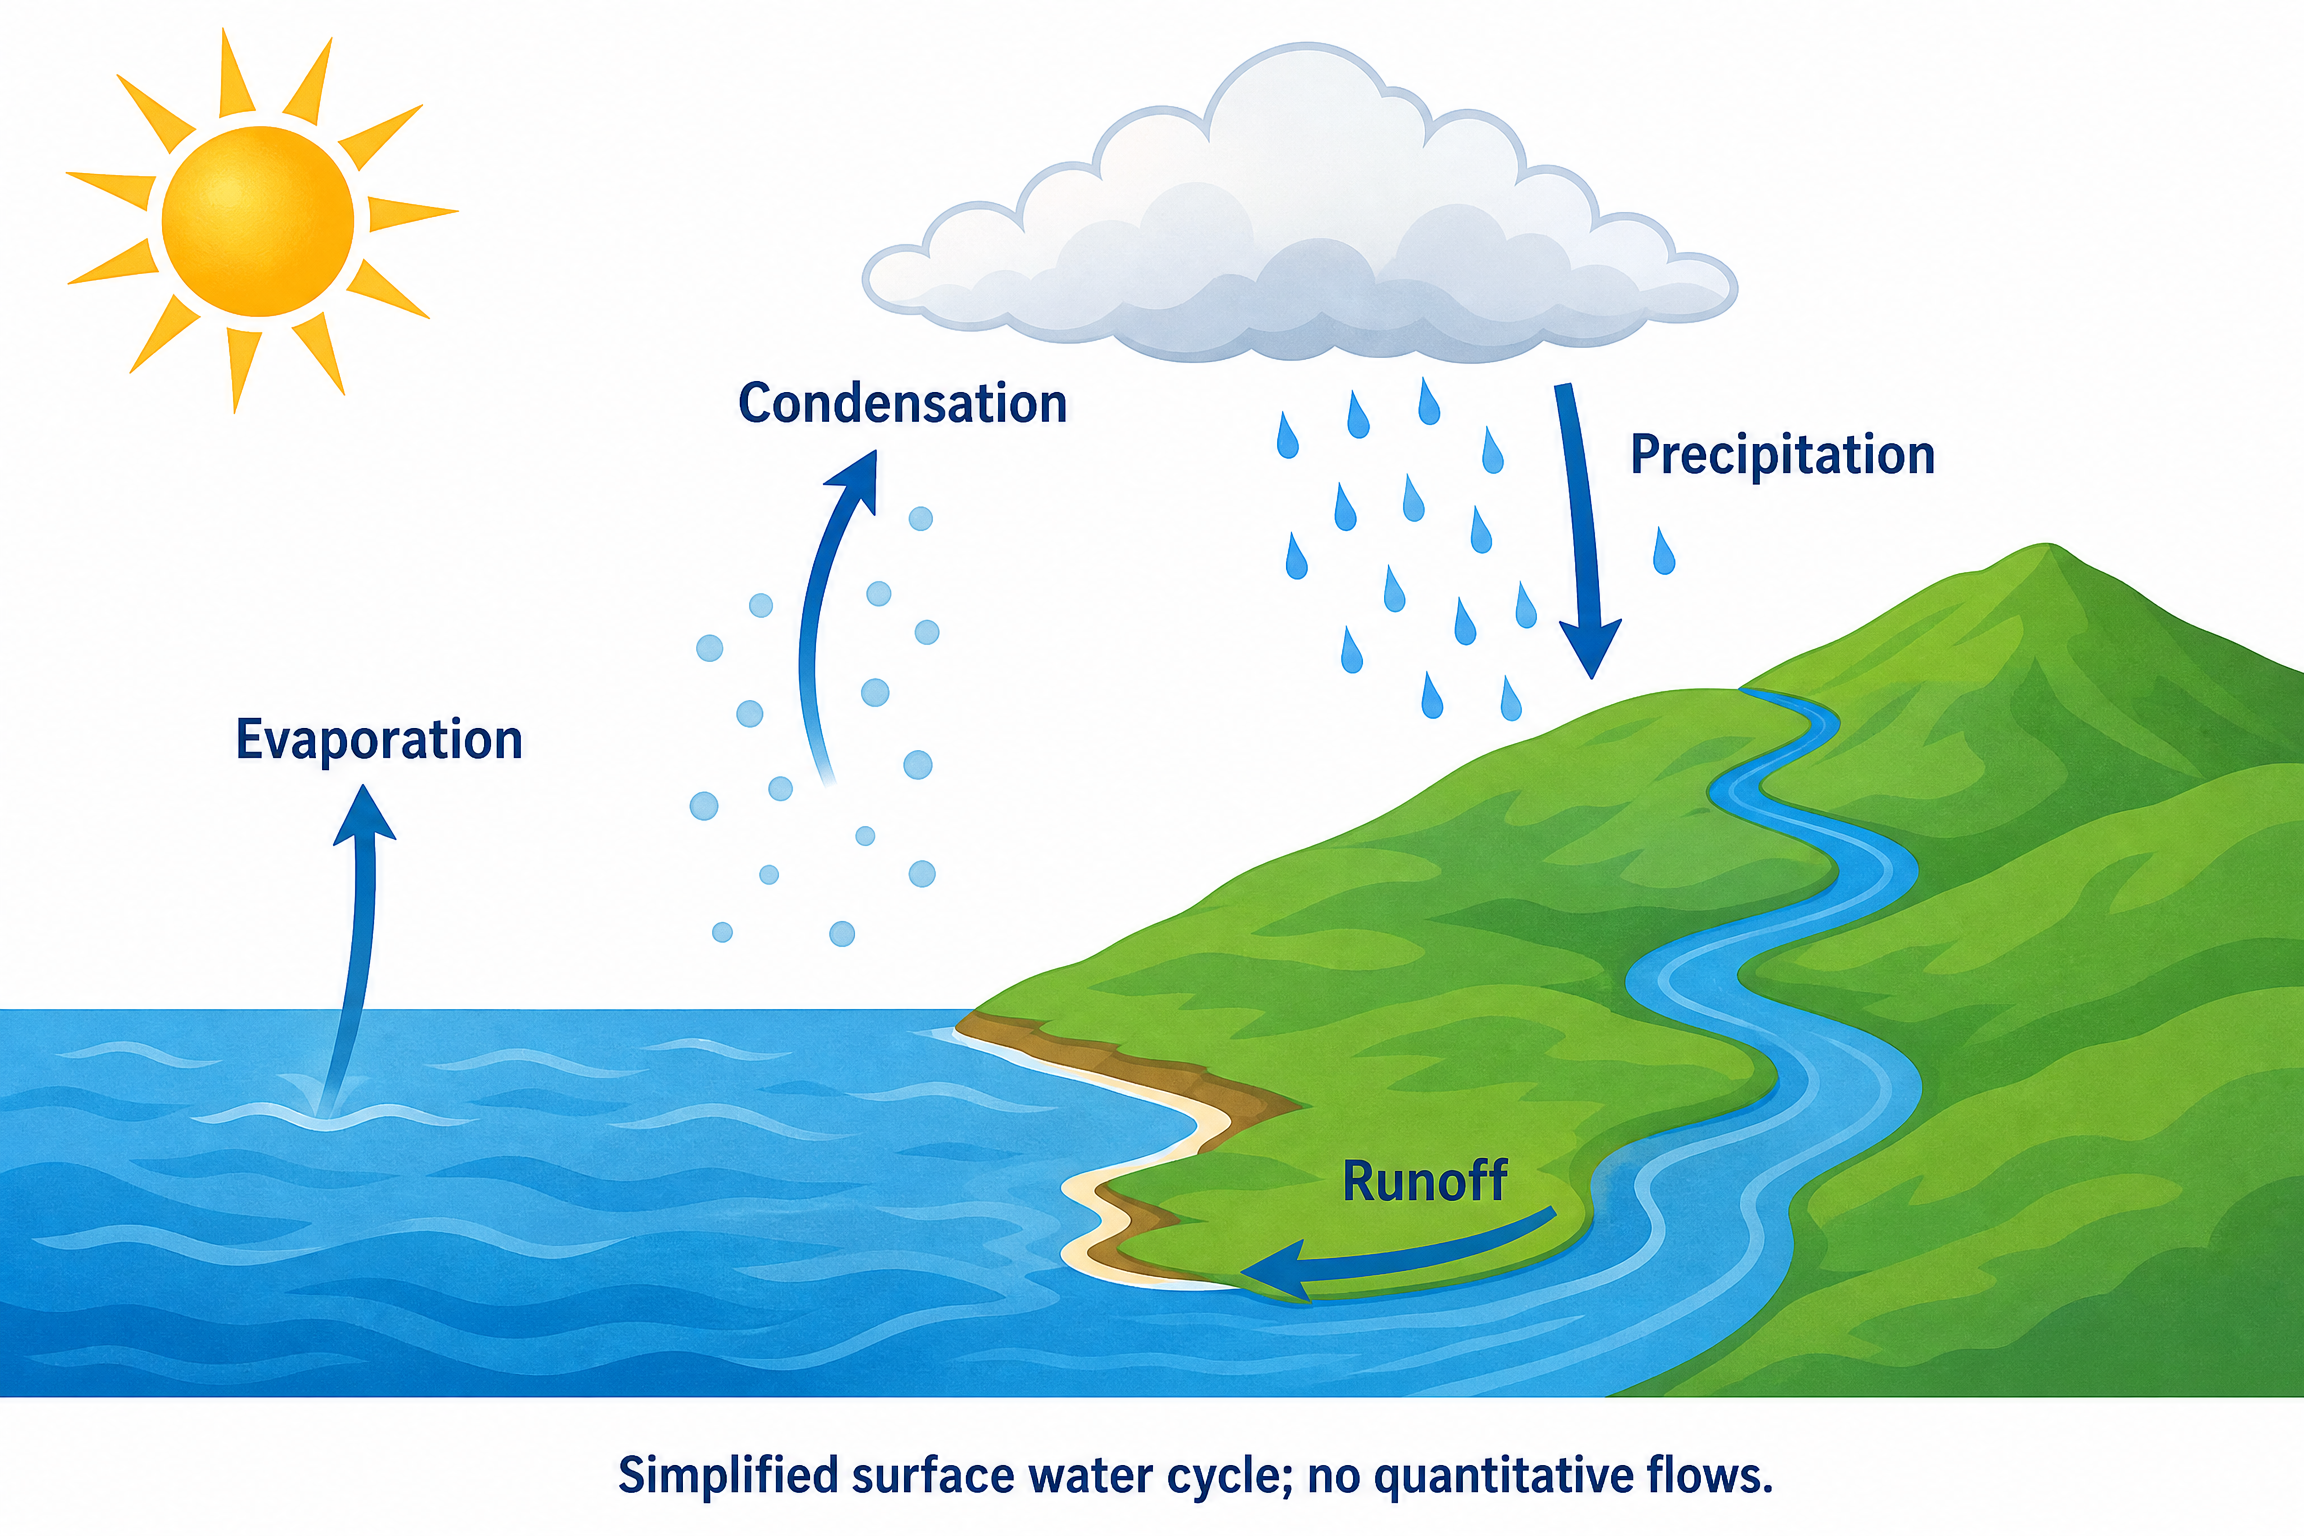
Create a full-color conceptual teaching landscape of a simplified surface water cycle on white. Put an ocean on the left, a hill and river on the right, and a cloud above. Show an upward arrow from the ocean surface labeled Evaporation; near the cloud show rising vapor becoming condensed droplets labeled Condensation; a downward arrow with rain from cloud to the hill labeled Precipitation; and an arrow following the river downhill back into the ocean labeled Runoff. Use exactly these four process labels. The arrows must connect water movement in the stated directions, not imply that a cloud is water vapor. Use blue water, green land and a warm sun; add no groundwater, plants, numerical rates or measured results. Add the exact footer: Simplified surface water cycle; no quantitative flows.
Reviewed output · self-authored simulated inputRead the example input
{
  "style": "flat-color",
  "brief": "Create a full-color conceptual teaching landscape of a simplified surface water cycle on white. Put an ocean on the left, a hill and river on the right, and a cloud above. Show an upward arrow from the ocean surface labeled Evaporation; near the cloud show rising vapor becoming condensed droplets labeled Condensation; a downward arrow with rain from cloud to the hill labeled Precipitation; and an arrow following the river downhill back into the ocean labeled Runoff. Use exactly these four process labels. The arrows must connect water movement in the stated directions, not imply that a cloud is water vapor. Use blue water, green land and a warm sun; add no groundwater, plants, numerical rates or measured results. Add the exact footer: Simplified surface water cycle; no quantitative flows."
}
Load the disclosed simulated illustration brief and review every label, connection and scientific detail. AI results vary between runs.
Connect four processes in a surface-water scene
The default landscape connects ocean water, cloud droplets, rainfall and a downhill river using four process labels: Evaporation, Condensation, Precipitation and Runoff. It places the ocean on the left and the hill and river on the right. Each arrow has a specific direction; a cloud should represent condensed droplets rather than water vapor itself.
The confirmed brief is sent to Image 2 at 2K for a separate raster illustration. Follow the arrows and inspect each label against the requested process. This surface subset intentionally omits groundwater and plants. It is not a complete hydrological budget, a weather forecast or a quantitative model of water movement.
Trace water between the named stores
Check that Evaporation starts at the ocean surface, Precipitation points downward toward land, and Runoff follows the river downhill to the ocean. A visually circular composition alone does not establish the correct process directions.
Separate vapor from cloud droplets
Inspect the transition around Condensation: rising vapor becomes condensed droplets near the cloud. Do not accept an image that uses a cloud as a synonym for vapor or reverses the requested change.
Keep the surface subset explicit
Groundwater, vegetation and numerical flows are absent by design. Retain the no-quantitative-flows footer and avoid presenting this four-process scene as a complete water budget or a measurement from a real watershed.
Review reference: NOAA: the water cycle. Check every label, direction and structural assumption against an appropriate subject reference.
How to use this tool
- Describe the subject and the exact relationships to show.
- Choose a style and aspect ratio; optionally add one permitted PNG reference.
- Review the brief and explicitly confirm generation.
- Inspect the result against the supplied scientific details.
- Download the original PNG or revise the brief for a new image.
Specifications and limits
- Route
- Independent Image 2 2K raster illustration; separate from native diagram engines
- Controls
- Scientific brief; line art, flat color or semi-realistic style; supported aspect ratios; optional PNG reference
- Reference
- One PNG up to 5 MiB, 8192 pixels per side and 24 million pixels; only material you may send
- Output
- Original PNG; labels are pixels, without SVG, PPTX or independently editable annotations
- Review
- User scientific review required; no scientific-accuracy or publication-acceptance guarantee
- Scope
- Simplified surface-water subset; no complete hydrological budget or quantitative flows
Guest native edits stay in this tab until you explicitly save a confirmed figure. Sign in to keep private works and revision history. Saved native works restore the figure and exports, not the original input form. AI tasks, images and references are private to their owner. Subscriptions and one-time packs are available for AI allowances. Native drawing and exports remain free. Understand export formats.
Frequently asked questions
Which four processes does the water cycle example include?
It requests Evaporation from the ocean, Condensation near the cloud, Precipitation from the cloud to the hill and Runoff along the river back to the ocean. These four exact process labels define the simplified surface example.
Does a cloud represent water vapor?
The example asks for condensed droplets in the cloud and distinguishes those droplets from rising water vapor. Inspect the image and arrow labels to ensure they do not present the cloud itself as water vapor.
Why are groundwater and transpiration missing?
The default brief deliberately limits the scene to a surface subset with four processes. It excludes groundwater and plants. Additional stores and processes need explicit instructions and review; the default is not a complete hydrological cycle.
Does the diagram calculate rainfall or water-flow rates?
No. The illustration has no quantitative flows, numerical rates or measured results. Arrow size and the drawn amount of rain should not be interpreted as measurements or predictions.
Can I change the landscape using a PNG reference?
Yes, with one eligible PNG you may send to the provider. State the ocean, hill, river, cloud and process directions you want preserved. Review the new draft because reference-guided generation can alter arrow positions and labels.
Can I download separate water-cycle arrows and labels?
The download is the original PNG with labels and arrows as pixels. This route has no independently editable annotation layer or SVG/PPTX objects. Supply a revised brief and explicitly regenerate for another draft.